|
Download Data (XLS File) |
|
||||||||||
|
||||||||||
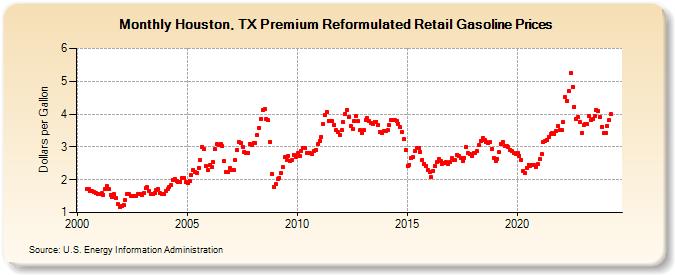
| Houston, TX Premium Reformulated Retail Gasoline Prices (Dollars per Gallon) | ||||||||||
| Year | Jan | Feb | Mar | Apr | May | Jun | Jul | Aug | Sep | Oct | Nov | Dec |
|---|---|---|---|---|---|---|---|---|---|---|---|---|
| 2000 | 1.717 | 1.720 | 1.657 | 1.643 | 1.623 | 1.593 | 1.553 | |||||
| 2001 | 1.564 | 1.583 | 1.547 | 1.715 | 1.802 | 1.712 | 1.545 | 1.486 | 1.552 | 1.443 | 1.255 | 1.172 |
| 2002 | 1.207 | 1.227 | 1.377 | 1.557 | 1.551 | 1.512 | 1.505 | 1.505 | 1.518 | 1.572 | 1.564 | 1.532 |
| 2003 | 1.599 | 1.738 | 1.775 | 1.670 | 1.571 | 1.563 | 1.594 | 1.676 | 1.707 | 1.582 | 1.557 | 1.551 |
| 2004 | 1.659 | 1.726 | 1.774 | 1.842 | 2.002 | 2.018 | 1.948 | 1.943 | 1.932 | 2.050 | 2.044 | 1.916 |
| 2005 | 1.904 | 1.961 | 2.136 | 2.299 | 2.222 | 2.218 | 2.366 | 2.587 | 3.011 | 2.936 | 2.410 | 2.286 |
| 2006 | 2.441 | 2.374 | 2.527 | 2.934 | 3.078 | 3.061 | 3.096 | 3.027 | 2.573 | 2.248 | 2.234 | 2.355 |
| 2007 | 2.289 | 2.291 | 2.588 | 2.920 | 3.148 | 3.111 | 3.006 | 2.846 | 2.803 | 2.824 | 3.090 | 3.068 |
| 2008 | 3.133 | 3.123 | 3.367 | 3.588 | 3.862 | 4.129 | 4.158 | 3.853 | 3.804 | 3.159 | 2.187 | 1.793 |
| 2009 | 1.861 | 2.016 | 2.066 | 2.201 | 2.384 | 2.687 | 2.597 | 2.726 | 2.566 | 2.597 | 2.748 | 2.688 |
| 2010 | 2.805 | 2.732 | 2.874 | 2.963 | 2.964 | 2.827 | 2.804 | 2.805 | 2.771 | 2.881 | 2.917 | 3.077 |
| 2011 | 3.185 | 3.311 | 3.703 | 3.972 | 4.065 | 3.803 | 3.795 | 3.777 | 3.660 | 3.500 | 3.444 | 3.359 |
| 2012 | 3.508 | 3.758 | 4.014 | 4.128 | 3.906 | 3.626 | 3.544 | 3.798 | 3.936 | 3.781 | 3.502 | 3.424 |
| 2013 | 3.511 | 3.816 | 3.875 | 3.777 | 3.729 | 3.710 | 3.767 | 3.771 | 3.657 | 3.456 | 3.410 | 3.484 |
| 2014 | 3.491 | 3.500 | 3.666 | 3.825 | 3.831 | 3.824 | 3.799 | 3.712 | 3.601 | 3.440 | 3.233 | 2.902 |
| 2015 | 2.428 | 2.459 | 2.662 | 2.704 | 2.865 | 2.963 | 2.971 | 2.839 | 2.601 | 2.487 | 2.423 | 2.309 |
| 2016 | 2.232 | 2.072 | 2.278 | 2.404 | 2.529 | 2.636 | 2.566 | 2.488 | 2.513 | 2.542 | 2.478 | 2.527 |
| 2017 | 2.651 | 2.595 | 2.603 | 2.763 | 2.727 | 2.647 | 2.567 | 2.675 | 2.996 | 2.819 | 2.781 | 2.718 |
| 2018 | 2.816 | 2.822 | 2.862 | 3.049 | 3.189 | 3.267 | 3.205 | 3.157 | 3.120 | 3.137 | 2.945 | 2.671 |
| 2019 | 2.571 | 2.638 | 2.833 | 3.100 | 3.149 | 3.012 | 3.016 | 2.984 | 2.915 | 2.863 | 2.809 | 2.798 |
| 2020 | 2.814 | 2.731 | 2.607 | 2.260 | 2.203 | 2.366 | 2.459 | 2.428 | 2.445 | 2.446 | 2.394 | 2.470 |
| 2021 | 2.630 | 2.783 | 3.134 | 3.177 | 3.215 | 3.313 | 3.398 | 3.419 | 3.399 | 3.489 | 3.635 | 3.524 |
| 2022 | 3.506 | 3.746 | 4.515 | 4.398 | 4.706 | 5.250 | 4.835 | 4.227 | 3.847 | 3.899 | 3.764 | 3.429 |
| 2023 | 3.667 | 3.687 | 3.685 | 3.953 | 3.807 | 3.837 | 3.936 | 4.134 | 4.089 | 3.903 | 3.619 | 3.417 |
| 2024 | 3.414 | 3.643 | 3.809 | 3.993 | 3.991 | 3.845 | 3.842 | 3.809 | ||||
| - = No Data Reported; -- = Not Applicable; NA = Not Available; W = Withheld to avoid disclosure of individual company data. |
| Release Date: 9/16/2024 |
| Next Release Date: 9/23/2024 |