|
Download Data (XLS File) |
|
||||||||||
|
||||||||||
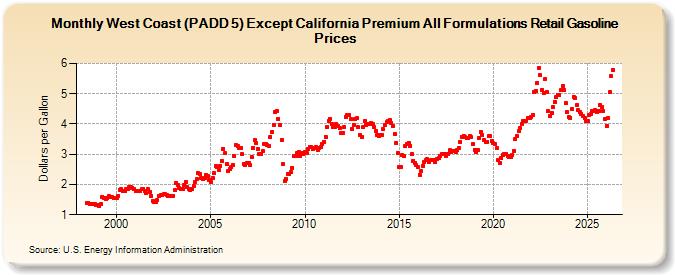
| West Coast (PADD 5) Except California Premium All Formulations Retail Gasoline Prices (Dollars per Gallon) | ||||||||||
| Year | Jan | Feb | Mar | Apr | May | Jun | Jul | Aug | Sep | Oct | Nov | Dec |
|---|---|---|---|---|---|---|---|---|---|---|---|---|
| 1998 | NA | 1.386 | 1.376 | 1.365 | 1.355 | 1.353 | 1.342 | 1.319 | ||||
| 1999 | 1.305 | 1.279 | 1.343 | 1.601 | 1.560 | 1.517 | 1.552 | 1.606 | 1.591 | 1.570 | 1.557 | 1.569 |
| 2000 | 1.567 | 1.620 | 1.817 | 1.858 | 1.797 | 1.777 | 1.835 | 1.840 | 1.904 | 1.915 | 1.897 | 1.844 |
| 2001 | 1.777 | 1.768 | 1.782 | 1.793 | 1.839 | 1.847 | 1.774 | 1.703 | 1.835 | 1.762 | 1.628 | 1.455 |
| 2002 | 1.419 | 1.413 | 1.478 | 1.619 | 1.637 | 1.658 | 1.677 | 1.674 | 1.656 | 1.628 | 1.631 | 1.605 |
| 2003 | 1.635 | 1.825 | 2.053 | 1.996 | 1.873 | 1.855 | 1.850 | 1.977 | 2.083 | 1.901 | 1.850 | 1.805 |
| 2004 | 1.843 | 1.947 | 2.095 | 2.171 | 2.369 | 2.346 | 2.219 | 2.180 | 2.214 | 2.315 | 2.292 | 2.158 |
| 2005 | 2.079 | 2.209 | 2.366 | 2.605 | 2.580 | 2.490 | 2.611 | 2.786 | 3.176 | 3.030 | 2.664 | 2.447 |
| 2006 | 2.516 | 2.561 | 2.642 | 2.936 | 3.308 | 3.256 | 3.211 | 3.206 | 2.998 | 2.692 | 2.635 | 2.715 |
| 2007 | 2.716 | 2.637 | 2.905 | 3.214 | 3.459 | 3.362 | 3.189 | 3.018 | 3.013 | 3.114 | 3.343 | 3.323 |
| 2008 | 3.292 | 3.278 | 3.572 | 3.734 | 3.975 | 4.407 | 4.438 | 4.174 | 3.950 | 3.484 | 2.675 | 2.104 |
| 2009 | 2.180 | 2.355 | 2.359 | 2.399 | 2.555 | 2.948 | 2.957 | 3.040 | 3.081 | 2.957 | 3.030 | 3.011 |
| 2010 | 3.067 | 3.043 | 3.157 | 3.246 | 3.230 | 3.169 | 3.203 | 3.231 | 3.147 | 3.190 | 3.244 | 3.333 |
| 2011 | 3.417 | 3.578 | 3.913 | 4.107 | 4.173 | 4.014 | 3.893 | 3.890 | 3.986 | 3.927 | 3.853 | 3.690 |
| 2012 | 3.718 | 3.909 | 4.234 | 4.313 | 4.305 | 4.153 | 3.835 | 3.977 | 4.172 | 4.187 | 3.895 | 3.640 |
| 2013 | 3.568 | 3.888 | 4.086 | 3.977 | 4.000 | 3.999 | 4.034 | 3.987 | 3.898 | 3.767 | 3.623 | 3.587 |
| 2014 | 3.623 | 3.650 | 3.826 | 3.981 | 4.053 | 4.108 | 4.118 | 4.045 | 3.933 | 3.664 | 3.377 | 3.047 |
| 2015 | 2.591 | 2.579 | 2.964 | 2.945 | 3.256 | 3.333 | 3.387 | 3.283 | 3.014 | 2.791 | 2.708 | 2.632 |
| 2016 | 2.575 | 2.320 | 2.435 | 2.624 | 2.741 | 2.816 | 2.837 | 2.731 | 2.795 | 2.823 | 2.802 | 2.745 |
| 2017 | 2.841 | 2.873 | 2.948 | 3.004 | 3.022 | 3.005 | 2.957 | 2.991 | 3.128 | 3.071 | 3.114 | 3.091 |
| 2018 | 3.080 | 3.139 | 3.209 | 3.417 | 3.578 | 3.616 | 3.567 | 3.520 | 3.526 | 3.611 | 3.553 | 3.334 |
| 2019 | 3.154 | 3.064 | 3.145 | 3.539 | 3.751 | 3.629 | 3.484 | 3.418 | 3.412 | 3.586 | 3.600 | 3.452 |
| 2020 | 3.357 | 3.330 | 3.200 | 2.802 | 2.705 | 2.867 | 2.980 | 3.009 | 3.005 | 2.951 | 2.920 | 2.906 |
| 2021 | 2.975 | 3.114 | 3.487 | 3.614 | 3.757 | 3.861 | 4.009 | 4.092 | 4.083 | 4.111 | 4.205 | 4.186 |
| 2022 | 4.223 | 4.304 | 5.062 | 5.104 | 5.357 | 5.864 | 5.605 | 5.133 | 5.036 | 5.488 | 5.059 | 4.419 |
| 2023 | 4.249 | 4.372 | 4.552 | 4.742 | 4.889 | 4.968 | 4.953 | 5.110 | 5.250 | 5.129 | 4.681 | 4.390 |
| 2024 | 4.219 | 4.213 | 4.510 | |||||||||
| - = No Data Reported; -- = Not Applicable; NA = Not Available; W = Withheld to avoid disclosure of individual company data. |
| Release Date: 4/22/2024 |
| Next Release Date: 4/29/2024 |