|
Download Data (XLS File) |
|
||||||||||
|
||||||||||
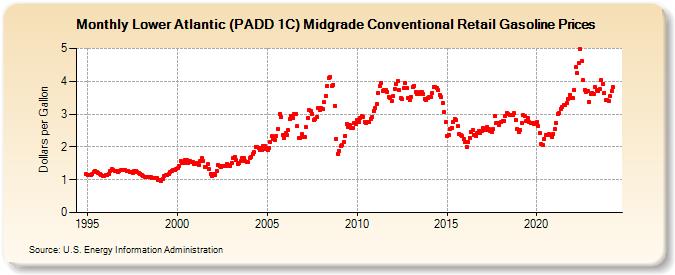
| Lower Atlantic (PADD 1C) Midgrade Conventional Retail Gasoline Prices (Dollars per Gallon) | ||||||||||
| Year | Jan | Feb | Mar | Apr | May | Jun | Jul | Aug | Sep | Oct | Nov | Dec |
|---|---|---|---|---|---|---|---|---|---|---|---|---|
| 1994 | NA | 1.167 | ||||||||||
| 1995 | 1.146 | 1.136 | 1.132 | 1.168 | 1.250 | 1.271 | 1.240 | 1.208 | 1.184 | 1.158 | 1.121 | 1.113 |
| 1996 | 1.130 | 1.133 | 1.178 | 1.278 | 1.319 | 1.302 | 1.272 | 1.255 | 1.246 | 1.257 | 1.288 | 1.300 |
| 1997 | 1.301 | 1.296 | 1.277 | 1.262 | 1.243 | 1.234 | 1.218 | 1.258 | 1.270 | 1.240 | 1.217 | 1.183 |
| 1998 | 1.145 | 1.110 | 1.083 | 1.087 | 1.094 | 1.086 | 1.080 | 1.058 | 1.041 | 1.058 | 1.048 | 1.000 |
| 1999 | 0.986 | 0.971 | 1.009 | 1.124 | 1.144 | 1.135 | 1.179 | 1.234 | 1.279 | 1.291 | 1.300 | 1.329 |
| 2000 | 1.344 | 1.432 | 1.573 | 1.514 | 1.518 | 1.608 | 1.604 | 1.512 | 1.556 | 1.546 | 1.527 | 1.467 |
| 2001 | 1.479 | 1.505 | 1.450 | 1.577 | 1.657 | 1.584 | 1.401 | 1.387 | 1.469 | 1.315 | 1.169 | 1.115 |
| 2002 | 1.160 | 1.153 | 1.274 | 1.445 | 1.428 | 1.401 | 1.406 | 1.411 | 1.416 | 1.489 | 1.461 | 1.427 |
| 2003 | 1.507 | 1.656 | 1.695 | 1.586 | 1.486 | 1.500 | 1.557 | 1.649 | 1.669 | 1.561 | 1.530 | 1.528 |
| 2004 | 1.650 | 1.707 | 1.774 | 1.835 | 2.001 | 2.008 | 1.954 | 1.908 | 1.920 | 2.039 | 2.037 | 1.932 |
| 2005 | 1.916 | 1.974 | 2.145 | 2.317 | 2.229 | 2.215 | 2.334 | 2.545 | 3.009 | 2.898 | 2.363 | 2.261 |
| 2006 | 2.423 | 2.363 | 2.511 | 2.853 | 2.929 | 2.890 | 3.014 | 3.013 | 2.627 | 2.285 | 2.285 | 2.381 |
| 2007 | 2.305 | 2.307 | 2.595 | 2.893 | 3.134 | 3.082 | 3.007 | 2.831 | 2.861 | 2.900 | 3.171 | 3.119 |
| 2008 | 3.173 | 3.149 | 3.356 | 3.559 | 3.866 | 4.104 | 4.124 | 3.855 | 3.896 | 3.259 | 2.253 | 1.798 |
| 2009 | 1.876 | 2.026 | 2.062 | 2.153 | 2.341 | 2.686 | 2.601 | 2.663 | 2.561 | 2.588 | 2.742 | 2.708 |
| 2010 | 2.822 | 2.754 | 2.882 | 2.928 | 2.922 | 2.761 | 2.739 | 2.760 | 2.747 | 2.861 | 2.922 | 3.087 |
| 2011 | 3.190 | 3.299 | 3.649 | 3.848 | 3.954 | 3.707 | 3.731 | 3.747 | 3.675 | 3.521 | 3.476 | 3.384 |
| 2012 | 3.543 | 3.765 | 3.926 | 4.000 | 3.722 | 3.475 | 3.451 | 3.788 | 3.942 | 3.790 | 3.503 | 3.438 |
| 2013 | 3.531 | 3.815 | 3.863 | 3.667 | 3.611 | 3.624 | 3.663 | 3.662 | 3.618 | 3.466 | 3.431 | 3.493 |
| 2014 | 3.517 | 3.519 | 3.641 | 3.826 | 3.837 | 3.788 | 3.725 | 3.588 | 3.524 | 3.338 | 3.056 | 2.749 |
| 2015 | 2.345 | 2.367 | 2.538 | 2.583 | 2.756 | 2.855 | 2.815 | 2.630 | 2.402 | 2.368 | 2.320 | 2.235 |
| 2016 | 2.145 | 1.990 | 2.152 | 2.280 | 2.448 | 2.501 | 2.374 | 2.342 | 2.431 | 2.484 | 2.414 | 2.491 |
| 2017 | 2.567 | 2.504 | 2.503 | 2.606 | 2.550 | 2.495 | 2.445 | 2.536 | 2.937 | 2.730 | 2.729 | 2.664 |
| 2018 | 2.753 | 2.799 | 2.785 | 2.938 | 3.043 | 3.009 | 2.976 | 2.986 | 2.980 | 3.023 | 2.812 | 2.539 |
| 2019 | 2.441 | 2.510 | 2.731 | 2.959 | 2.944 | 2.793 | 2.876 | 2.749 | 2.734 | 2.730 | 2.702 | 2.732 |
| 2020 | 2.751 | 2.625 | 2.416 | 2.090 | 2.056 | 2.247 | 2.363 | 2.359 | 2.384 | 2.369 | 2.300 | 2.401 |
| 2021 | 2.539 | 2.718 | 3.005 | 3.030 | 3.160 | 3.228 | 3.274 | 3.284 | 3.323 | 3.468 | 3.595 | 3.503 |
| 2022 | 3.490 | 3.736 | 4.419 | 4.249 | 4.542 | 4.972 | 4.605 | 4.029 | 3.741 | 3.678 | 3.697 | 3.374 |
| 2023 | 3.601 | 3.646 | 3.626 | 3.830 | 3.737 | 3.693 | 3.751 | 4.035 | 3.918 | 3.651 | 3.416 | 3.416 |
| 2024 | 3.409 | 3.548 | 3.712 | |||||||||
| - = No Data Reported; -- = Not Applicable; NA = Not Available; W = Withheld to avoid disclosure of individual company data. |
| Release Date: 4/22/2024 |
| Next Release Date: 4/29/2024 |