|
Download Data (XLS File) |
|
||||||||||
|
||||||||||
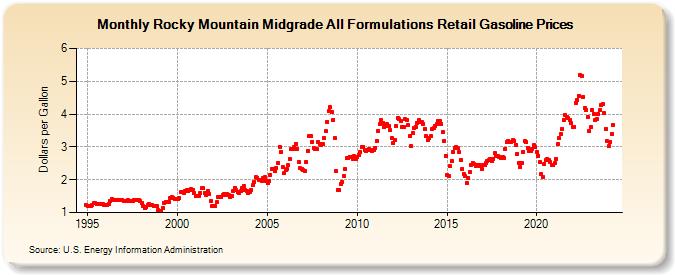
| Rocky Mountain Midgrade All Formulations Retail Gasoline Prices (Dollars per Gallon) | ||||||||||
| Year | Jan | Feb | Mar | Apr | May | Jun | Jul | Aug | Sep | Oct | Nov | Dec |
|---|---|---|---|---|---|---|---|---|---|---|---|---|
| 1994 | NA | 1.228 | ||||||||||
| 1995 | 1.213 | 1.189 | 1.206 | 1.239 | 1.283 | 1.288 | 1.273 | 1.258 | 1.262 | 1.256 | 1.246 | 1.239 |
| 1996 | 1.229 | 1.224 | 1.268 | 1.347 | 1.419 | 1.390 | 1.368 | 1.372 | 1.370 | 1.376 | 1.376 | 1.369 |
| 1997 | 1.366 | 1.357 | 1.350 | 1.372 | 1.353 | 1.357 | 1.366 | 1.387 | 1.382 | 1.379 | 1.368 | 1.354 |
| 1998 | 1.302 | 1.206 | 1.134 | 1.167 | 1.219 | 1.254 | 1.231 | 1.218 | 1.204 | 1.198 | 1.187 | 1.085 |
| 1999 | 1.044 | 1.062 | 1.127 | 1.299 | 1.328 | 1.308 | 1.335 | 1.437 | 1.471 | 1.456 | 1.421 | 1.425 |
| 2000 | 1.399 | 1.456 | 1.617 | 1.632 | 1.585 | 1.650 | 1.688 | 1.649 | 1.695 | 1.707 | 1.696 | 1.590 |
| 2001 | 1.511 | 1.519 | 1.517 | 1.607 | 1.742 | 1.733 | 1.600 | 1.520 | 1.652 | 1.552 | 1.357 | 1.208 |
| 2002 | 1.210 | 1.198 | 1.308 | 1.482 | 1.477 | 1.479 | 1.529 | 1.557 | 1.532 | 1.560 | 1.535 | 1.477 |
| 2003 | 1.509 | 1.669 | 1.758 | 1.690 | 1.611 | 1.600 | 1.642 | 1.749 | 1.814 | 1.694 | 1.658 | 1.606 |
| 2004 | 1.638 | 1.689 | 1.831 | 1.939 | 2.075 | 2.060 | 2.003 | 1.987 | 1.968 | 2.058 | 2.069 | 1.963 |
| 2005 | 1.890 | 1.973 | 2.148 | 2.329 | 2.321 | 2.263 | 2.362 | 2.523 | 3.007 | 2.855 | 2.393 | 2.193 |
| 2006 | 2.284 | 2.340 | 2.435 | 2.625 | 2.935 | 2.944 | 2.999 | 3.102 | 2.944 | 2.546 | 2.349 | 2.339 |
| 2007 | 2.294 | 2.271 | 2.554 | 2.886 | 3.319 | 3.320 | 3.161 | 2.968 | 2.932 | 2.929 | 3.143 | 3.090 |
| 2008 | 3.052 | 3.080 | 3.269 | 3.474 | 3.768 | 4.088 | 4.204 | 4.053 | 3.831 | 3.269 | 2.267 | 1.688 |
| 2009 | 1.684 | 1.869 | 1.937 | 2.126 | 2.322 | 2.649 | 2.664 | 2.704 | 2.699 | 2.644 | 2.709 | 2.642 |
| 2010 | 2.694 | 2.741 | 2.844 | 2.997 | 3.009 | 2.895 | 2.861 | 2.905 | 2.930 | 2.904 | 2.884 | 2.896 |
| 2011 | 2.978 | 3.180 | 3.486 | 3.686 | 3.825 | 3.729 | 3.608 | 3.636 | 3.685 | 3.622 | 3.505 | 3.278 |
| 2012 | 3.117 | 3.215 | 3.645 | 3.881 | 3.856 | 3.797 | 3.621 | 3.620 | 3.835 | 3.833 | 3.665 | 3.331 |
| 2013 | 3.021 | 3.435 | 3.580 | 3.621 | 3.718 | 3.819 | 3.750 | 3.757 | 3.712 | 3.552 | 3.330 | 3.202 |
| 2014 | 3.259 | 3.327 | 3.560 | 3.567 | 3.643 | 3.692 | 3.779 | 3.781 | 3.701 | 3.446 | 3.189 | 2.726 |
| 2015 | 2.131 | 2.103 | 2.413 | 2.572 | 2.853 | 2.963 | 2.991 | 2.964 | 2.834 | 2.600 | 2.330 | 2.176 |
| 2016 | 2.107 | 1.906 | 2.052 | 2.242 | 2.460 | 2.516 | 2.469 | 2.429 | 2.455 | 2.460 | 2.415 | 2.333 |
| 2017 | 2.441 | 2.448 | 2.513 | 2.557 | 2.595 | 2.627 | 2.562 | 2.640 | 2.800 | 2.736 | 2.721 | 2.687 |
| 2018 | 2.657 | 2.691 | 2.657 | 2.948 | 3.139 | 3.189 | 3.155 | 3.152 | 3.215 | 3.189 | 3.067 | 2.794 |
| 2019 | 2.518 | 2.394 | 2.500 | 2.854 | 3.167 | 3.138 | 2.974 | 2.867 | 2.866 | 2.936 | 3.043 | 2.983 |
| 2020 | 2.842 | 2.734 | 2.535 | 2.167 | 2.092 | 2.479 | 2.590 | 2.628 | 2.588 | 2.529 | 2.462 | 2.449 |
| 2021 | 2.500 | 2.637 | 3.087 | 3.256 | 3.388 | 3.549 | 3.822 | 3.971 | 3.924 | 3.869 | 3.829 | 3.715 |
| 2022 | 3.616 | 3.608 | 4.348 | 4.443 | 4.562 | 5.183 | 5.169 | 4.524 | 4.171 | 4.134 | 3.925 | 3.476 |
| 2023 | 3.605 | 4.122 | 4.006 | 3.806 | 3.856 | 4.008 | 4.115 | 4.281 | 4.314 | 4.031 | 3.553 | 3.166 |
| 2024 | 3.014 | 3.156 | 3.401 | |||||||||
| - = No Data Reported; -- = Not Applicable; NA = Not Available; W = Withheld to avoid disclosure of individual company data. |
| Release Date: 4/22/2024 |
| Next Release Date: 4/29/2024 |