|
Download Data (XLS File) |
|
||||||||||
|
||||||||||
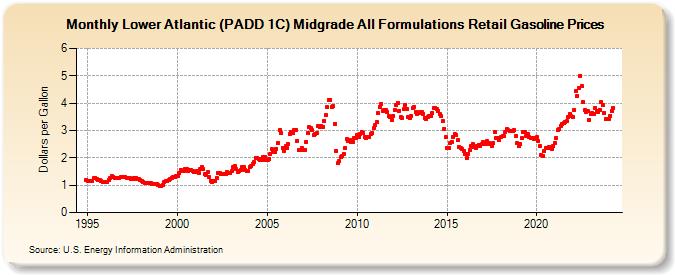
| Lower Atlantic (PADD 1C) Midgrade All Formulations Retail Gasoline Prices (Dollars per Gallon) | ||||||||||
| Year | Jan | Feb | Mar | Apr | May | Jun | Jul | Aug | Sep | Oct | Nov | Dec |
|---|---|---|---|---|---|---|---|---|---|---|---|---|
| 1994 | NA | 1.173 | ||||||||||
| 1995 | 1.153 | 1.142 | 1.136 | 1.170 | 1.250 | 1.272 | 1.240 | 1.207 | 1.185 | 1.159 | 1.124 | 1.116 |
| 1996 | 1.132 | 1.135 | 1.180 | 1.280 | 1.324 | 1.303 | 1.276 | 1.260 | 1.251 | 1.260 | 1.292 | 1.303 |
| 1997 | 1.303 | 1.298 | 1.279 | 1.264 | 1.246 | 1.236 | 1.221 | 1.261 | 1.273 | 1.242 | 1.218 | 1.185 |
| 1998 | 1.148 | 1.112 | 1.085 | 1.090 | 1.096 | 1.088 | 1.082 | 1.059 | 1.042 | 1.059 | 1.048 | 1.001 |
| 1999 | 0.987 | 0.972 | 1.010 | 1.125 | 1.146 | 1.138 | 1.179 | 1.234 | 1.280 | 1.292 | 1.301 | 1.330 |
| 2000 | 1.344 | 1.429 | 1.572 | 1.516 | 1.520 | 1.609 | 1.607 | 1.517 | 1.560 | 1.548 | 1.530 | 1.470 |
| 2001 | 1.481 | 1.507 | 1.453 | 1.580 | 1.662 | 1.588 | 1.408 | 1.389 | 1.467 | 1.311 | 1.168 | 1.114 |
| 2002 | 1.159 | 1.152 | 1.274 | 1.447 | 1.431 | 1.403 | 1.407 | 1.413 | 1.418 | 1.490 | 1.462 | 1.429 |
| 2003 | 1.509 | 1.655 | 1.694 | 1.587 | 1.490 | 1.502 | 1.557 | 1.647 | 1.671 | 1.565 | 1.532 | 1.527 |
| 2004 | 1.648 | 1.706 | 1.773 | 1.832 | 2.000 | 2.008 | 1.953 | 1.909 | 1.918 | 2.038 | 2.033 | 1.925 |
| 2005 | 1.913 | 1.970 | 2.141 | 2.314 | 2.225 | 2.215 | 2.335 | 2.547 | 3.015 | 2.891 | 2.355 | 2.259 |
| 2006 | 2.421 | 2.361 | 2.509 | 2.855 | 2.940 | 2.901 | 3.021 | 3.012 | 2.619 | 2.279 | 2.280 | 2.377 |
| 2007 | 2.302 | 2.303 | 2.592 | 2.894 | 3.134 | 3.081 | 3.006 | 2.830 | 2.855 | 2.892 | 3.166 | 3.114 |
| 2008 | 3.167 | 3.144 | 3.354 | 3.557 | 3.865 | 4.105 | 4.125 | 3.853 | 3.888 | 3.250 | 2.253 | 1.800 |
| 2009 | 1.874 | 2.024 | 2.060 | 2.153 | 2.342 | 2.685 | 2.601 | 2.665 | 2.564 | 2.589 | 2.741 | 2.709 |
| 2010 | 2.821 | 2.754 | 2.880 | 2.930 | 2.923 | 2.764 | 2.742 | 2.762 | 2.747 | 2.862 | 2.922 | 3.087 |
| 2011 | 3.189 | 3.296 | 3.650 | 3.854 | 3.962 | 3.716 | 3.737 | 3.748 | 3.674 | 3.520 | 3.477 | 3.384 |
| 2012 | 3.536 | 3.759 | 3.927 | 4.007 | 3.730 | 3.483 | 3.457 | 3.787 | 3.938 | 3.789 | 3.505 | 3.439 |
| 2013 | 3.531 | 3.813 | 3.862 | 3.675 | 3.617 | 3.630 | 3.670 | 3.666 | 3.614 | 3.464 | 3.431 | 3.497 |
| 2014 | 3.517 | 3.516 | 3.641 | 3.825 | 3.835 | 3.791 | 3.729 | 3.589 | 3.522 | 3.336 | 3.058 | 2.751 |
| 2015 | 2.350 | 2.371 | 2.542 | 2.583 | 2.758 | 2.858 | 2.824 | 2.639 | 2.409 | 2.372 | 2.322 | 2.234 |
| 2016 | 2.144 | 1.990 | 2.152 | 2.281 | 2.449 | 2.506 | 2.381 | 2.345 | 2.431 | 2.483 | 2.415 | 2.493 |
| 2017 | 2.568 | 2.504 | 2.503 | 2.606 | 2.551 | 2.496 | 2.448 | 2.537 | 2.929 | 2.725 | 2.728 | 2.665 |
| 2018 | 2.752 | 2.797 | 2.785 | 2.937 | 3.044 | 3.012 | 2.974 | 2.982 | 2.973 | 3.014 | 2.806 | 2.536 |
| 2019 | 2.437 | 2.504 | 2.724 | 2.954 | 2.946 | 2.798 | 2.874 | 2.746 | 2.725 | 2.720 | 2.696 | 2.723 |
| 2020 | 2.745 | 2.620 | 2.418 | 2.104 | 2.069 | 2.253 | 2.366 | 2.365 | 2.392 | 2.377 | 2.316 | 2.415 |
| 2021 | 2.548 | 2.726 | 3.014 | 3.040 | 3.170 | 3.239 | 3.282 | 3.293 | 3.330 | 3.475 | 3.601 | 3.512 |
| 2022 | 3.498 | 3.740 | 4.425 | 4.260 | 4.558 | 5.000 | 4.616 | 4.033 | 3.735 | 3.689 | 3.701 | 3.374 |
| 2023 | 3.597 | 3.632 | 3.618 | 3.826 | 3.730 | 3.692 | 3.758 | 4.028 | 3.914 | 3.656 | 3.423 | 3.415 |
| 2024 | 3.406 | 3.547 | 3.707 | 3.815 | 3.819 | 3.707 | 3.764 | 3.658 | ||||
| - = No Data Reported; -- = Not Applicable; NA = Not Available; W = Withheld to avoid disclosure of individual company data. |
| Release Date: 9/16/2024 |
| Next Release Date: 9/23/2024 |