|
Download Data (XLS File) |
|
||||||||||
|
||||||||||
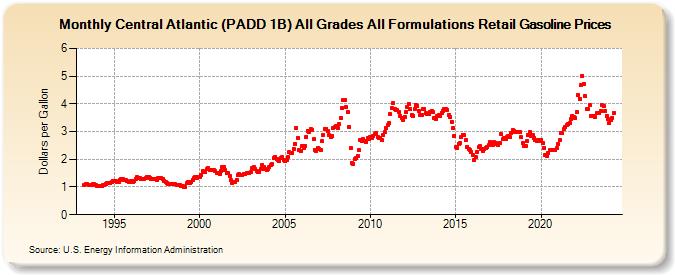
| Central Atlantic (PADD 1B) All Grades All Formulations Retail Gasoline Prices (Dollars per Gallon) | ||||||||||
| Year | Jan | Feb | Mar | Apr | May | Jun | Jul | Aug | Sep | Oct | Nov | Dec |
|---|---|---|---|---|---|---|---|---|---|---|---|---|
| 1993 | 1.074 | 1.092 | 1.096 | 1.088 | 1.074 | 1.061 | 1.102 | 1.090 | 1.061 | |||
| 1994 | 1.036 | 1.038 | 1.033 | 1.033 | 1.056 | 1.088 | 1.114 | 1.158 | 1.160 | 1.151 | 1.178 | 1.226 |
| 1995 | 1.219 | 1.199 | 1.186 | 1.195 | 1.269 | 1.301 | 1.284 | 1.255 | 1.238 | 1.211 | 1.177 | 1.185 |
| 1996 | 1.200 | 1.193 | 1.210 | 1.289 | 1.354 | 1.339 | 1.311 | 1.286 | 1.276 | 1.281 | 1.317 | 1.353 |
| 1997 | 1.356 | 1.342 | 1.305 | 1.275 | 1.275 | 1.278 | 1.261 | 1.309 | 1.342 | 1.308 | 1.272 | 1.234 |
| 1998 | 1.194 | 1.144 | 1.097 | 1.102 | 1.114 | 1.119 | 1.110 | 1.093 | 1.078 | 1.088 | 1.074 | 1.034 |
| 1999 | 1.018 | 0.993 | 1.012 | 1.128 | 1.164 | 1.161 | 1.198 | 1.268 | 1.315 | 1.344 | 1.340 | 1.364 |
| 2000 | 1.370 | 1.418 | 1.569 | 1.544 | 1.537 | 1.640 | 1.670 | 1.608 | 1.620 | 1.605 | 1.599 | 1.559 |
| 2001 | 1.521 | 1.515 | 1.476 | 1.573 | 1.737 | 1.724 | 1.596 | 1.504 | 1.495 | 1.380 | 1.243 | 1.156 |
| 2002 | 1.178 | 1.178 | 1.270 | 1.440 | 1.457 | 1.443 | 1.447 | 1.474 | 1.480 | 1.499 | 1.510 | 1.509 |
| 2003 | 1.557 | 1.670 | 1.719 | 1.658 | 1.577 | 1.538 | 1.556 | 1.645 | 1.788 | 1.706 | 1.639 | 1.599 |
| 2004 | 1.655 | 1.721 | 1.787 | 1.819 | 2.038 | 2.092 | 2.018 | 1.978 | 1.949 | 2.063 | 2.064 | 1.969 |
| 2005 | 1.932 | 1.973 | 2.088 | 2.252 | 2.226 | 2.231 | 2.382 | 2.561 | 3.137 | 2.784 | 2.350 | 2.287 |
| 2006 | 2.464 | 2.403 | 2.463 | 2.814 | 3.035 | 2.996 | 3.088 | 3.071 | 2.714 | 2.344 | 2.299 | 2.423 |
| 2007 | 2.388 | 2.335 | 2.643 | 2.883 | 3.105 | 3.102 | 3.018 | 2.859 | 2.807 | 2.849 | 3.135 | 3.151 |
| 2008 | 3.184 | 3.135 | 3.284 | 3.490 | 3.848 | 4.138 | 4.146 | 3.875 | 3.703 | 3.180 | 2.392 | 1.878 |
| 2009 | 1.844 | 2.009 | 2.032 | 2.117 | 2.333 | 2.680 | 2.643 | 2.715 | 2.663 | 2.615 | 2.759 | 2.725 |
| 2010 | 2.814 | 2.764 | 2.829 | 2.898 | 2.930 | 2.803 | 2.782 | 2.768 | 2.706 | 2.868 | 2.987 | 3.142 |
| 2011 | 3.219 | 3.298 | 3.619 | 3.849 | 4.016 | 3.819 | 3.778 | 3.762 | 3.709 | 3.563 | 3.501 | 3.402 |
| 2012 | 3.530 | 3.723 | 3.891 | 4.004 | 3.819 | 3.595 | 3.573 | 3.808 | 3.974 | 3.925 | 3.750 | 3.611 |
| 2013 | 3.604 | 3.829 | 3.820 | 3.674 | 3.618 | 3.633 | 3.718 | 3.744 | 3.691 | 3.497 | 3.450 | 3.562 |
| 2014 | 3.584 | 3.578 | 3.678 | 3.747 | 3.816 | 3.815 | 3.778 | 3.614 | 3.524 | 3.352 | 3.124 | 2.855 |
| 2015 | 2.438 | 2.393 | 2.567 | 2.597 | 2.810 | 2.882 | 2.867 | 2.682 | 2.457 | 2.357 | 2.332 | 2.265 |
| 2016 | 2.150 | 1.981 | 2.070 | 2.264 | 2.429 | 2.469 | 2.386 | 2.312 | 2.357 | 2.398 | 2.447 | 2.512 |
| 2017 | 2.626 | 2.558 | 2.524 | 2.611 | 2.600 | 2.554 | 2.514 | 2.587 | 2.902 | 2.719 | 2.772 | 2.721 |
| 2018 | 2.799 | 2.843 | 2.789 | 2.947 | 3.050 | 3.019 | 2.983 | 2.981 | 2.982 | 2.966 | 2.787 | 2.576 |
| 2019 | 2.462 | 2.475 | 2.649 | 2.871 | 2.966 | 2.839 | 2.869 | 2.782 | 2.697 | 2.676 | 2.688 | 2.675 |
| 2020 | 2.708 | 2.599 | 2.424 | 2.138 | 2.104 | 2.233 | 2.319 | 2.323 | 2.349 | 2.346 | 2.327 | 2.407 |
| 2021 | 2.542 | 2.698 | 2.941 | 2.936 | 3.082 | 3.160 | 3.225 | 3.258 | 3.307 | 3.439 | 3.567 | 3.521 |
| 2022 | 3.498 | 3.709 | 4.335 | 4.187 | 4.674 | 5.015 | 4.720 | 4.271 | 3.806 | 3.798 | 3.952 | 3.572 |
| 2023 | 3.570 | 3.560 | 3.507 | 3.657 | 3.678 | 3.677 | 3.734 | 3.942 | 3.905 | 3.755 | 3.572 | 3.443 |
| 2024 | 3.323 | 3.399 | 3.492 | |||||||||
| - = No Data Reported; -- = Not Applicable; NA = Not Available; W = Withheld to avoid disclosure of individual company data. |
| Release Date: 4/22/2024 |
| Next Release Date: 4/29/2024 |