|
Download Data (XLS File) |
|
||||||||||
|
||||||||||
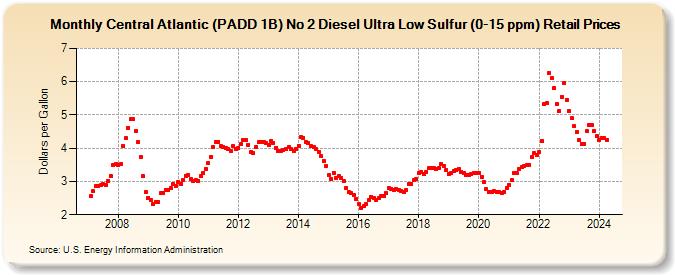
| Central Atlantic (PADD 1B) No 2 Diesel Ultra Low Sulfur (0-15 ppm) Retail Prices (Dollars per Gallon) | ||||||||||
| Year | Jan | Feb | Mar | Apr | May | Jun | Jul | Aug | Sep | Oct | Nov | Dec |
|---|---|---|---|---|---|---|---|---|---|---|---|---|
| 2007 | 2.555 | 2.700 | 2.858 | 2.863 | 2.880 | 2.930 | 2.908 | 3.024 | 3.168 | 3.501 | 3.524 | |
| 2008 | 3.499 | 3.523 | 4.071 | 4.294 | 4.618 | 4.867 | 4.863 | 4.510 | 4.184 | 3.735 | 3.152 | 2.681 |
| 2009 | 2.512 | 2.439 | 2.320 | 2.397 | 2.389 | 2.644 | 2.661 | 2.750 | 2.742 | 2.792 | 2.916 | 2.865 |
| 2010 | 2.991 | 2.930 | 3.052 | 3.174 | 3.200 | 3.084 | 3.027 | 3.044 | 3.025 | 3.160 | 3.258 | 3.375 |
| 2011 | 3.541 | 3.748 | 4.046 | 4.191 | 4.189 | 4.063 | 4.042 | 4.000 | 3.966 | 3.921 | 4.060 | 3.977 |
| 2012 | 4.006 | 4.131 | 4.260 | 4.261 | 4.108 | 3.891 | 3.851 | 4.034 | 4.174 | 4.183 | 4.174 | 4.145 |
| 2013 | 4.099 | 4.224 | 4.164 | 4.019 | 3.919 | 3.910 | 3.938 | 3.976 | 4.033 | 3.961 | 3.913 | 3.980 |
| 2014 | 4.074 | 4.340 | 4.308 | 4.194 | 4.149 | 4.078 | 4.032 | 3.965 | 3.900 | 3.761 | 3.625 | 3.465 |
| 2015 | 3.188 | 3.082 | 3.269 | 3.098 | 3.151 | 3.116 | 3.004 | 2.805 | 2.680 | 2.639 | 2.597 | 2.473 |
| 2016 | 2.328 | 2.203 | 2.252 | 2.316 | 2.435 | 2.534 | 2.510 | 2.442 | 2.492 | 2.554 | 2.562 | 2.647 |
| 2017 | 2.789 | 2.768 | 2.751 | 2.767 | 2.749 | 2.702 | 2.682 | 2.757 | 2.913 | 2.928 | 3.031 | 3.063 |
| 2018 | 3.241 | 3.290 | 3.220 | 3.271 | 3.395 | 3.410 | 3.396 | 3.386 | 3.409 | 3.516 | 3.474 | 3.340 |
| 2019 | 3.228 | 3.249 | 3.310 | 3.346 | 3.370 | 3.298 | 3.264 | 3.208 | 3.201 | 3.233 | 3.246 | 3.248 |
| 2020 | 3.264 | 3.142 | 2.978 | 2.767 | 2.675 | 2.682 | 2.700 | 2.690 | 2.671 | 2.651 | 2.685 | 2.817 |
| 2021 | 2.904 | 3.038 | 3.266 | 3.263 | 3.367 | 3.438 | 3.476 | 3.484 | 3.495 | 3.730 | 3.853 | 3.802 |
| 2022 | 3.880 | 4.224 | 5.318 | 5.347 | 6.262 | 6.117 | 5.797 | 5.327 | 5.119 | 5.549 | 5.946 | 5.459 |
| 2023 | 5.121 | 4.897 | 4.659 | 4.485 | 4.251 | 4.132 | 4.136 | 4.516 | 4.697 | 4.691 | 4.514 | 4.381 |
| 2024 | 4.252 | 4.318 | 4.304 | |||||||||
| - = No Data Reported; -- = Not Applicable; NA = Not Available; W = Withheld to avoid disclosure of individual company data. |
| Release Date: 4/22/2024 |
| Next Release Date: 4/29/2024 |