|
Download Data (XLS File) |
|
||||||||||
|
||||||||||
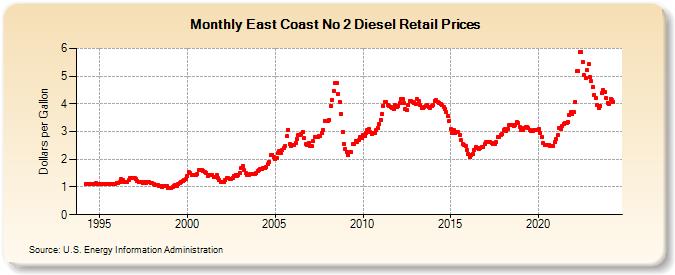
| East Coast No 2 Diesel Retail Prices (Dollars per Gallon) | ||||||||||
| Year | Jan | Feb | Mar | Apr | May | Jun | Jul | Aug | Sep | Oct | Nov | Dec |
|---|---|---|---|---|---|---|---|---|---|---|---|---|
| 1994 | NA | 1.118 | 1.110 | 1.110 | 1.117 | 1.124 | 1.117 | 1.115 | 1.127 | 1.117 | ||
| 1995 | 1.113 | 1.102 | 1.093 | 1.098 | 1.122 | 1.119 | 1.103 | 1.100 | 1.107 | 1.102 | 1.100 | 1.115 |
| 1996 | 1.150 | 1.158 | 1.196 | 1.271 | 1.248 | 1.185 | 1.170 | 1.189 | 1.243 | 1.317 | 1.316 | 1.319 |
| 1997 | 1.312 | 1.286 | 1.221 | 1.196 | 1.185 | 1.163 | 1.151 | 1.164 | 1.153 | 1.183 | 1.182 | 1.160 |
| 1998 | 1.129 | 1.104 | 1.077 | 1.073 | 1.073 | 1.050 | 1.038 | 1.009 | 1.021 | 1.039 | 1.024 | 0.981 |
| 1999 | 0.976 | 0.966 | 0.993 | 1.053 | 1.055 | 1.052 | 1.101 | 1.147 | 1.197 | 1.216 | 1.246 | 1.284 |
| 2000 | 1.397 | 1.553 | 1.488 | 1.419 | 1.421 | 1.426 | 1.440 | 1.473 | 1.620 | 1.618 | 1.629 | 1.587 |
| 2001 | 1.558 | 1.517 | 1.407 | 1.431 | 1.447 | 1.438 | 1.374 | 1.372 | 1.422 | 1.315 | 1.245 | 1.184 |
| 2002 | 1.184 | 1.180 | 1.242 | 1.310 | 1.312 | 1.291 | 1.302 | 1.325 | 1.393 | 1.448 | 1.411 | 1.433 |
| 2003 | 1.514 | 1.699 | 1.770 | 1.600 | 1.497 | 1.437 | 1.442 | 1.474 | 1.458 | 1.474 | 1.479 | 1.499 |
| 2004 | 1.584 | 1.609 | 1.635 | 1.649 | 1.689 | 1.690 | 1.720 | 1.820 | 1.912 | 2.138 | 2.167 | 2.068 |
| 2005 | 2.019 | 2.046 | 2.213 | 2.288 | 2.215 | 2.322 | 2.394 | 2.483 | 2.827 | 3.062 | 2.545 | 2.467 |
| 2006 | 2.509 | 2.506 | 2.583 | 2.748 | 2.887 | 2.890 | 2.910 | 2.988 | 2.759 | 2.538 | 2.524 | 2.602 |
| 2007 | 2.470 | 2.476 | 2.648 | 2.815 | 2.787 | 2.804 | 2.852 | 2.841 | 2.944 | 3.066 | 3.391 | 3.386 |
| 2008 | 3.374 | 3.429 | 3.933 | 4.140 | 4.474 | 4.734 | 4.762 | 4.361 | 4.078 | 3.647 | 2.998 | 2.559 |
| 2009 | 2.374 | 2.268 | 2.163 | 2.264 | 2.266 | 2.550 | 2.558 | 2.663 | 2.637 | 2.683 | 2.812 | 2.763 |
| 2010 | 2.889 | 2.834 | 2.944 | 3.068 | 3.083 | 2.968 | 2.927 | 2.959 | 2.938 | 3.050 | 3.140 | 3.257 |
| 2011 | 3.429 | 3.634 | 3.936 | 4.070 | 4.059 | 3.950 | 3.937 | 3.894 | 3.856 | 3.808 | 3.944 | 3.891 |
| 2012 | 3.916 | 4.041 | 4.178 | 4.167 | 4.025 | 3.797 | 3.768 | 3.975 | 4.109 | 4.090 | 4.054 | 4.041 |
| 2013 | 4.008 | 4.160 | 4.105 | 3.964 | 3.866 | 3.841 | 3.875 | 3.916 | 3.969 | 3.902 | 3.861 | 3.919 |
| 2014 | 3.958 | 4.116 | 4.132 | 4.070 | 4.036 | 3.985 | 3.944 | 3.881 | 3.819 | 3.690 | 3.557 | 3.384 |
| 2015 | 3.081 | 2.957 | 3.058 | 2.935 | 2.999 | 2.972 | 2.884 | 2.683 | 2.563 | 2.525 | 2.486 | 2.346 |
| 2016 | 2.201 | 2.076 | 2.145 | 2.208 | 2.344 | 2.443 | 2.415 | 2.353 | 2.398 | 2.451 | 2.454 | 2.538 |
| 2017 | 2.632 | 2.627 | 2.609 | 2.622 | 2.605 | 2.556 | 2.538 | 2.619 | 2.810 | 2.803 | 2.884 | 2.902 |
| 2018 | 3.052 | 3.096 | 3.029 | 3.110 | 3.243 | 3.250 | 3.228 | 3.217 | 3.247 | 3.350 | 3.304 | 3.166 |
| 2019 | 3.051 | 3.059 | 3.125 | 3.157 | 3.177 | 3.114 | 3.074 | 3.028 | 3.028 | 3.047 | 3.050 | 3.062 |
| 2020 | 3.088 | 2.959 | 2.788 | 2.589 | 2.499 | 2.507 | 2.524 | 2.513 | 2.492 | 2.468 | 2.485 | 2.622 |
| 2021 | 2.724 | 2.884 | 3.126 | 3.101 | 3.195 | 3.275 | 3.310 | 3.316 | 3.348 | 3.589 | 3.702 | 3.626 |
| 2022 | 3.720 | 4.077 | 5.183 | 5.174 | 5.861 | 5.868 | 5.520 | 5.031 | 4.927 | 5.211 | 5.424 | 4.963 |
| 2023 | 4.812 | 4.606 | 4.330 | 4.194 | 3.958 | 3.857 | 3.934 | 4.387 | 4.504 | 4.431 | 4.198 | 4.045 |
| 2024 | 3.995 | 4.167 | 4.131 | |||||||||
| - = No Data Reported; -- = Not Applicable; NA = Not Available; W = Withheld to avoid disclosure of individual company data. |
| Release Date: 4/22/2024 |
| Next Release Date: 4/29/2024 |