|
Download Data (XLS File) |
|
||||||||
|
||||||||
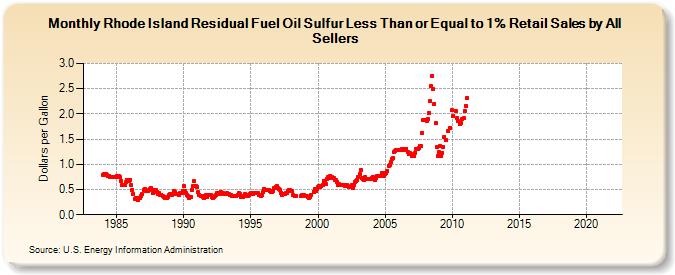
| Rhode Island Residual Fuel Oil Sulfur Less Than or Equal to 1% Retail Sales by All Sellers (Dollars per Gallon) | ||||||||
| Year | Jan | Feb | Mar | Apr | May | Jun | Jul | Aug | Sep | Oct | Nov | Dec |
|---|---|---|---|---|---|---|---|---|---|---|---|---|
| 1983 | - | W | W | W | W | W | W | W | W | W | W | W |
| 1984 | 0.796 | 0.816 | 0.812 | 0.787 | 0.768 | 0.770 | 0.753 | 0.747 | 0.744 | 0.746 | 0.753 | 0.754 |
| 1985 | 0.763 | 0.774 | 0.767 | 0.741 | 0.673 | 0.595 | 0.586 | 0.580 | 0.643 | 0.682 | 0.686 | 0.664 |
| 1986 | 0.694 | 0.580 | 0.495 | 0.410 | 0.317 | 0.336 | 0.304 | 0.296 | 0.327 | 0.326 | 0.370 | 0.401 |
| 1987 | 0.493 | 0.506 | 0.468 | 0.479 | 0.471 | 0.486 | 0.502 | 0.523 | 0.438 | 0.482 | 0.490 | 0.482 |
| 1988 | 0.453 | 0.414 | 0.423 | 0.394 | 0.397 | 0.376 | 0.348 | 0.339 | 0.358 | 0.339 | 0.354 | 0.382 |
| 1989 | 0.401 | 0.395 | 0.405 | 0.461 | 0.443 | 0.413 | 0.408 | 0.405 | 0.394 | 0.427 | 0.427 | 0.473 |
| 1990 | 0.565 | 0.480 | 0.429 | 0.389 | 0.367 | 0.332 | 0.356 | 0.489 | 0.567 | 0.660 | 0.576 | 0.568 |
| 1991 | 0.551 | 0.441 | 0.395 | 0.375 | 0.373 | 0.360 | 0.330 | 0.366 | 0.385 | 0.352 | 0.396 | 0.396 |
| 1992 | 0.382 | 0.347 | 0.341 | 0.346 | 0.378 | 0.394 | 0.421 | 0.436 | 0.401 | 0.456 | 0.440 | 0.425 |
| 1993 | 0.407 | 0.409 | 0.406 | 0.422 | 0.410 | 0.389 | 0.396 | 0.378 | 0.377 | 0.378 | 0.380 | 0.365 |
| 1994 | 0.395 | 0.429 | 0.401 | 0.344 | 0.345 | 0.360 | 0.379 | 0.415 | 0.382 | 0.378 | 0.390 | 0.417 |
| 1995 | 0.423 | 0.404 | 0.419 | 0.421 | 0.426 | 0.440 | 0.435 | 0.394 | 0.383 | 0.380 | 0.394 | 0.448 |
| 1996 | 0.519 | 0.491 | 0.486 | 0.485 | 0.491 | 0.461 | 0.450 | 0.447 | 0.473 | 0.528 | 0.546 | 0.567 |
| 1997 | 0.534 | 0.510 | 0.491 | 0.438 | 0.393 | 0.402 | 0.413 | 0.434 | 0.433 | 0.475 | 0.500 | 0.481 |
| 1998 | 0.467 | 0.466 | 0.398 | 0.363 | 0.370 | W | W | W | W | 0.373 | 0.386 | 0.388 |
| 1999 | 0.380 | 0.368 | 0.371 | 0.359 | 0.340 | 0.358 | 0.388 | W | 0.456 | 0.501 | 0.476 | 0.505 |
| 2000 | 0.542 | 0.562 | 0.556 | 0.571 | 0.588 | 0.677 | 0.678 | 0.604 | 0.710 | 0.739 | 0.731 | 0.768 |
| 2001 | 0.754 | 0.727 | 0.724 | 0.690 | 0.682 | 0.651 | 0.592 | 0.602 | 0.599 | 0.584 | 0.583 | 0.590 |
| 2002 | 0.573 | 0.570 | 0.583 | 0.564 | 0.542 | NA | 0.592 | 0.524 | 0.585 | 0.652 | 0.659 | 0.681 |
| 2003 | 0.755 | 0.805 | 0.888 | 0.720 | 0.700 | 0.684 | 0.739 | 0.718 | 0.705 | 0.717 | 0.711 | 0.712 |
| 2004 | 0.736 | 0.758 | 0.709 | 0.694 | 0.734 | 0.769 | 0.771 | 0.765 | 0.765 | 0.828 | 0.822 | 0.772 |
| 2005 | 0.806 | 0.825 | 0.868 | 0.974 | 0.995 | 1.039 | 1.101 | 1.124 | 1.237 | 1.273 | 1.285 | 1.277 |
| 2006 | 1.282 | 1.291 | 1.274 | 1.296 | 1.305 | 1.293 | 1.302 | 1.312 | 1.249 | 1.212 | 1.226 | 1.197 |
| 2007 | 1.157 | 1.171 | 1.157 | 1.230 | 1.305 | 1.296 | 1.329 | 1.368 | 1.362 | 1.621 | 1.870 | 1.886 |
| 2008 | 1.876 | 1.866 | 1.896 | 2.024 | 2.249 | 2.547 | 2.753 | 2.498 | 2.204 | 1.815 | 1.337 | 1.164 |
| 2009 | 1.238 | 1.356 | 1.167 | 1.227 | 1.340 | 1.547 | 1.490 | NA | 1.664 | NA | 1.722 | NA |
| 2010 | 2.071 | 1.968 | NA | 2.063 | 1.909 | 1.854 | W | 1.804 | 1.821 | 1.900 | 1.915 | 2.059 |
| 2011 | 2.166 | 2.320 | - | - | - | - | - | - | - | - | - | - |
| 2012 | - | - | - | - | - | - | - | - | - | - | - | - |
| 2013 | - | - | - | - | - | - | - | - | - | - | - | - |
| 2014 | - | - | - | - | - | - | - | - | - | - | - | - |
| 2015 | - | - | - | - | - | - | - | - | - | - | - | - |
| 2016 | - | - | - | - | - | - | - | - | - | - | - | - |
| 2017 | - | - | - | - | - | - | - | - | - | - | - | - |
| 2018 | - | - | - | - | - | - | - | - | - | - | - | - |
| 2019 | - | - | - | - | - | - | - | - | - | - | - | - |
| 2020 | - | - | - | - | - | - | - | - | - | - | - | - |
| 2021 | - | - | - | - | - | - | - | - | - | - | - | - |
| 2022 | - | - | - | |||||||||
| - = No Data Reported; -- = Not Applicable; NA = Not Available; W = Withheld to avoid disclosure of individual company data. |
| Release Date: 6/1/2022 |
| Next Release Date: TBD |