|
Download Data (XLS File) |
|
||||||||
|
||||||||
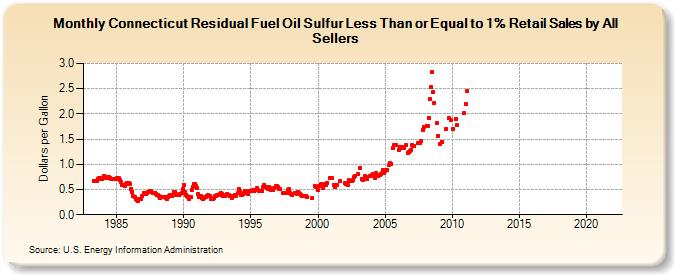
| Connecticut Residual Fuel Oil Sulfur Less Than or Equal to 1% Retail Sales by All Sellers (Dollars per Gallon) | ||||||||
| Year | Jan | Feb | Mar | Apr | May | Jun | Jul | Aug | Sep | Oct | Nov | Dec |
|---|---|---|---|---|---|---|---|---|---|---|---|---|
| 1983 | W | W | W | W | 0.660 | 0.665 | 0.675 | 0.716 | 0.721 | 0.719 | 0.707 | 0.706 |
| 1984 | 0.735 | 0.766 | 0.748 | 0.734 | 0.731 | 0.739 | 0.734 | 0.703 | 0.713 | 0.715 | 0.706 | 0.714 |
| 1985 | 0.724 | 0.731 | 0.722 | 0.682 | 0.642 | 0.596 | 0.589 | 0.566 | 0.614 | 0.627 | 0.606 | 0.623 |
| 1986 | 0.616 | 0.519 | 0.446 | 0.374 | 0.349 | 0.321 | 0.285 | 0.265 | 0.308 | 0.315 | 0.318 | 0.367 |
| 1987 | 0.432 | 0.435 | 0.405 | 0.434 | 0.444 | 0.454 | 0.467 | 0.462 | 0.423 | 0.432 | 0.433 | 0.415 |
| 1988 | 0.399 | 0.384 | 0.362 | 0.341 | 0.359 | 0.353 | 0.344 | 0.352 | 0.336 | 0.316 | 0.343 | 0.374 |
| 1989 | 0.400 | 0.366 | 0.399 | 0.458 | 0.452 | 0.415 | 0.399 | 0.388 | 0.382 | 0.420 | 0.435 | 0.502 |
| 1990 | 0.597 | 0.451 | 0.398 | 0.368 | 0.354 | 0.316 | 0.345 | 0.485 | 0.555 | 0.607 | 0.616 | 0.567 |
| 1991 | 0.527 | 0.403 | 0.357 | 0.366 | 0.341 | 0.313 | 0.336 | 0.346 | 0.361 | 0.371 | 0.386 | 0.367 |
| 1992 | 0.320 | 0.319 | 0.306 | 0.327 | 0.373 | 0.378 | 0.400 | 0.392 | 0.411 | 0.440 | 0.412 | 0.364 |
| 1993 | 0.365 | 0.374 | 0.383 | 0.420 | 0.394 | 0.375 | 0.366 | 0.340 | 0.374 | 0.378 | 0.397 | 0.372 |
| 1994 | 0.424 | 0.509 | 0.462 | 0.390 | 0.394 | 0.402 | 0.429 | 0.474 | 0.424 | 0.415 | 0.461 | 0.465 |
| 1995 | 0.478 | 0.477 | 0.485 | 0.461 | 0.489 | 0.521 | 0.486 | 0.464 | 0.464 | 0.461 | 0.476 | 0.541 |
| 1996 | 0.589 | 0.540 | 0.529 | 0.520 | 0.540 | 0.527 | 0.496 | 0.507 | 0.494 | 0.527 | 0.567 | 0.576 |
| 1997 | 0.541 | 0.520 | 0.502 | NA | W | 0.430 | 0.440 | 0.439 | 0.437 | 0.482 | 0.504 | 0.436 |
| 1998 | 0.414 | 0.389 | NA | 0.426 | 0.421 | 0.419 | 0.455 | 0.427 | 0.407 | 0.394 | 0.380 | 0.374 |
| 1999 | 0.372 | 0.367 | 0.358 | NA | W | W | W | 0.332 | W | 0.570 | 0.548 | W |
| 2000 | 0.491 | 0.562 | W | 0.601 | 0.523 | W | 0.604 | 0.597 | 0.634 | W | W | 0.734 |
| 2001 | 0.723 | NA | 0.595 | 0.558 | NA | 0.596 | W | W | 0.659 | W | W | NA |
| 2002 | 0.621 | 0.602 | 0.629 | 0.589 | 0.681 | 0.660 | 0.676 | 0.686 | 0.739 | 0.774 | NA | NA |
| 2003 | 0.811 | 0.936 | NA | 0.711 | 0.682 | W | 0.760 | 0.757 | 0.703 | NA | 0.777 | 0.776 |
| 2004 | 0.792 | 0.799 | 0.788 | 0.736 | 0.823 | NA | 0.769 | 0.790 | 0.803 | 0.822 | 0.884 | 0.833 |
| 2005 | 0.865 | 0.894 | 0.884 | 0.986 | 1.019 | 1.006 | NA | 1.322 | 1.388 | 1.376 | 1.377 | NA |
| 2006 | 1.289 | 1.346 | 1.333 | 1.342 | 1.318 | 1.330 | NA | 1.378 | 1.230 | 1.250 | 1.263 | 1.289 |
| 2007 | 1.379 | 1.357 | 1.365 | NA | W | 1.414 | W | 1.421 | 1.467 | W | 1.686 | 1.747 |
| 2008 | NA | 1.760 | 1.760 | 1.919 | 2.293 | 2.531 | 2.827 | 2.439 | 2.208 | NA | 1.810 | 1.563 |
| 2009 | NA | 1.401 | NA | 1.440 | NA | W | 1.693 | W | W | 1.922 | NA | 1.871 |
| 2010 | NA | 1.697 | NA | 1.908 | 1.773 | W | W | W | W | W | 2.008 | W |
| 2011 | 2.199 | 2.459 | - | - | - | - | - | - | - | - | - | - |
| 2012 | - | - | - | - | - | - | - | - | - | - | - | - |
| 2013 | - | - | - | - | - | - | - | - | - | - | - | - |
| 2014 | - | - | - | - | - | - | - | - | - | - | - | - |
| 2015 | - | - | - | - | - | - | - | - | - | - | - | - |
| 2016 | - | - | - | - | - | - | - | - | - | - | - | - |
| 2017 | - | - | - | - | - | - | - | - | - | - | - | - |
| 2018 | - | - | - | - | - | - | - | - | - | - | - | - |
| 2019 | - | - | - | - | - | - | - | - | - | - | - | - |
| 2020 | - | - | - | - | - | - | - | - | - | - | - | - |
| 2021 | - | - | - | - | - | - | - | - | - | - | - | - |
| 2022 | - | - | - | |||||||||
| - = No Data Reported; -- = Not Applicable; NA = Not Available; W = Withheld to avoid disclosure of individual company data. |
| Release Date: 6/1/2022 |
| Next Release Date: TBD |