|
Download Data (XLS File) |
|
||||||||
|
||||||||
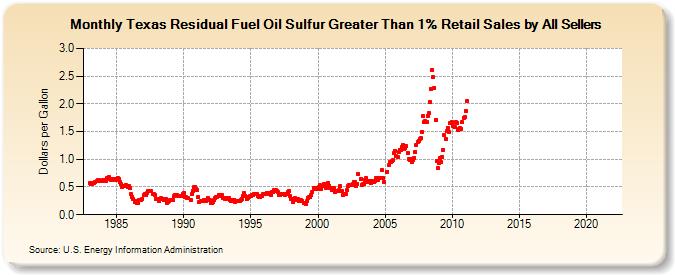
| Texas Residual Fuel Oil Sulfur Greater Than 1% Retail Sales by All Sellers (Dollars per Gallon) | ||||||||
| Year | Jan | Feb | Mar | Apr | May | Jun | Jul | Aug | Sep | Oct | Nov | Dec |
|---|---|---|---|---|---|---|---|---|---|---|---|---|
| 1983 | 0.566 | 0.545 | 0.545 | 0.569 | 0.581 | 0.588 | 0.602 | 0.621 | 0.629 | 0.613 | 0.611 | 0.600 |
| 1984 | 0.620 | 0.624 | 0.617 | 0.655 | 0.661 | 0.672 | 0.642 | 0.633 | 0.635 | 0.639 | 0.642 | 0.633 |
| 1985 | 0.651 | 0.659 | 0.645 | 0.595 | 0.546 | 0.500 | 0.523 | 0.525 | 0.541 | 0.510 | 0.508 | 0.518 |
| 1986 | 0.482 | 0.367 | 0.324 | 0.277 | 0.221 | 0.252 | 0.210 | 0.211 | 0.263 | 0.267 | 0.265 | 0.289 |
| 1987 | 0.350 | 0.375 | 0.351 | 0.387 | 0.431 | 0.421 | 0.431 | 0.423 | 0.377 | 0.372 | 0.361 | 0.289 |
| 1988 | 0.290 | 0.289 | 0.247 | 0.281 | 0.297 | 0.292 | 0.264 | 0.277 | 0.276 | 0.220 | 0.230 | 0.246 |
| 1989 | 0.267 | 0.267 | 0.271 | 0.333 | 0.360 | 0.351 | 0.348 | 0.336 | 0.330 | 0.343 | 0.333 | 0.376 |
| 1990 | 0.397 | 0.318 | 0.319 | 0.297 | 0.295 | NA | 0.257 | 0.369 | 0.433 | 0.493 | 0.503 | 0.464 |
| 1991 | 0.446 | 0.318 | 0.236 | 0.242 | 0.240 | 0.246 | 0.262 | 0.247 | 0.249 | 0.272 | 0.294 | 0.257 |
| 1992 | 0.211 | 0.213 | 0.221 | 0.257 | 0.301 | 0.319 | 0.327 | 0.353 | 0.331 | 0.359 | 0.347 | 0.298 |
| 1993 | 0.294 | 0.276 | 0.289 | 0.305 | 0.301 | 0.270 | 0.251 | 0.268 | 0.269 | 0.272 | 0.237 | 0.240 |
| 1994 | 0.253 | 0.251 | 0.241 | 0.272 | 0.290 | 0.331 | 0.389 | 0.338 | 0.281 | 0.310 | 0.325 | 0.334 |
| 1995 | 0.337 | 0.350 | 0.359 | 0.376 | 0.381 | 0.372 | 0.329 | 0.317 | 0.319 | 0.329 | 0.342 | 0.375 |
| 1996 | 0.378 | 0.380 | 0.392 | 0.400 | 0.386 | 0.378 | 0.362 | 0.407 | 0.414 | 0.438 | 0.443 | 0.427 |
| 1997 | 0.413 | 0.357 | 0.350 | 0.369 | 0.369 | 0.371 | 0.355 | 0.381 | 0.378 | 0.401 | 0.422 | 0.344 |
| 1998 | 0.286 | 0.279 | 0.222 | 0.299 | 0.270 | 0.269 | 0.287 | 0.251 | 0.243 | 0.264 | 0.249 | 0.207 |
| 1999 | 0.220 | 0.202 | 0.240 | 0.304 | 0.316 | 0.318 | 0.352 | 0.415 | 0.488 | 0.471 | 0.465 | 0.483 |
| 2000 | 0.466 | 0.498 | 0.529 | 0.470 | 0.510 | 0.551 | 0.511 | 0.485 | 0.556 | 0.579 | 0.525 | 0.476 |
| 2001 | 0.454 | 0.489 | 0.483 | 0.405 | 0.425 | 0.424 | 0.423 | 0.452 | 0.514 | 0.421 | 0.355 | 0.365 |
| 2002 | 0.373 | 0.376 | 0.440 | 0.509 | 0.534 | 0.539 | 0.539 | 0.554 | 0.597 | 0.583 | 0.511 | 0.553 |
| 2003 | 0.737 | NA | 0.642 | 0.543 | 0.548 | 0.561 | 0.635 | 0.660 | 0.590 | 0.612 | 0.605 | 0.576 |
| 2004 | 0.603 | 0.582 | 0.587 | 0.608 | 0.671 | 0.660 | 0.631 | 0.658 | 0.666 | 0.804 | 0.667 | 0.591 |
| 2005 | NA | NA | 0.775 | 0.896 | 0.953 | 0.954 | 0.960 | 0.986 | 1.106 | 1.154 | 1.052 | 1.043 |
| 2006 | 1.124 | 1.174 | 1.167 | 1.222 | 1.261 | 1.190 | 1.197 | 1.239 | 1.115 | 1.000 | 0.992 | 1.003 |
| 2007 | 0.948 | 0.982 | 1.024 | 1.128 | 1.257 | 1.312 | 1.336 | 1.365 | 1.381 | 1.488 | 1.778 | 1.672 |
| 2008 | 1.683 | 1.680 | 1.781 | 1.826 | 2.041 | 2.273 | 2.615 | 2.482 | 2.293 | 1.713 | 0.968 | 0.839 |
| 2009 | 0.924 | 1.019 | 0.944 | 1.044 | 1.166 | 1.434 | 1.374 | 1.502 | 1.570 | 1.492 | 1.651 | 1.655 |
| 2010 | 1.666 | 1.594 | 1.577 | 1.668 | 1.651 | 1.522 | 1.548 | 1.556 | 1.552 | 1.666 | 1.747 | 1.767 |
| 2011 | 1.871 | 2.049 | - | - | - | - | - | - | - | - | - | - |
| 2012 | - | - | - | - | - | - | - | - | - | - | - | - |
| 2013 | - | - | - | - | - | - | - | - | - | - | - | - |
| 2014 | - | - | - | - | - | - | - | - | - | - | - | - |
| 2015 | - | - | - | - | - | - | - | - | - | - | - | - |
| 2016 | - | - | - | - | - | - | - | - | - | - | - | - |
| 2017 | - | - | - | - | - | - | - | - | - | - | - | - |
| 2018 | - | - | - | - | - | - | - | - | - | - | - | - |
| 2019 | - | - | - | - | - | - | - | - | - | - | - | - |
| 2020 | - | - | - | - | - | - | - | - | - | - | - | - |
| 2021 | - | - | - | - | - | - | - | - | - | - | - | - |
| 2022 | - | - | - | |||||||||
| - = No Data Reported; -- = Not Applicable; NA = Not Available; W = Withheld to avoid disclosure of individual company data. |
| Release Date: 6/1/2022 |
| Next Release Date: TBD |