|
Download Data (XLS File) |
|
||||||||
|
||||||||
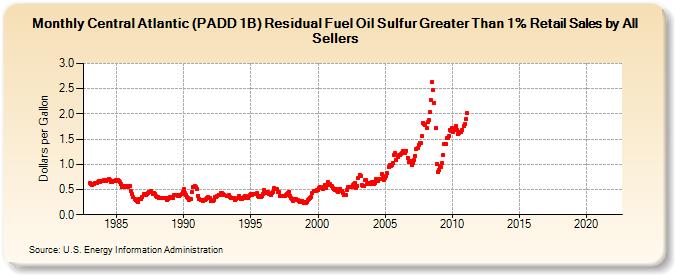
| Central Atlantic (PADD 1B) Residual Fuel Oil Sulfur Greater Than 1% Retail Sales by All Sellers (Dollars per Gallon) | ||||||||
| Year | Jan | Feb | Mar | Apr | May | Jun | Jul | Aug | Sep | Oct | Nov | Dec |
|---|---|---|---|---|---|---|---|---|---|---|---|---|
| 1983 | 0.627 | 0.600 | 0.585 | 0.616 | 0.607 | 0.621 | 0.620 | 0.642 | 0.671 | 0.657 | 0.661 | 0.660 |
| 1984 | 0.673 | 0.693 | 0.675 | 0.689 | 0.693 | 0.704 | 0.681 | 0.658 | 0.655 | 0.673 | 0.675 | 0.681 |
| 1985 | 0.687 | 0.682 | 0.676 | 0.643 | 0.606 | 0.545 | 0.563 | 0.542 | 0.560 | 0.559 | 0.556 | 0.569 |
| 1986 | 0.573 | 0.461 | 0.404 | 0.344 | 0.306 | 0.286 | 0.265 | 0.246 | 0.305 | 0.313 | 0.309 | 0.346 |
| 1987 | 0.409 | 0.405 | 0.398 | 0.419 | 0.434 | 0.456 | 0.456 | 0.463 | 0.413 | 0.422 | 0.418 | 0.378 |
| 1988 | 0.357 | 0.361 | 0.335 | 0.331 | 0.338 | 0.341 | 0.322 | 0.332 | 0.328 | 0.291 | 0.304 | 0.328 |
| 1989 | 0.347 | 0.324 | 0.338 | 0.396 | 0.389 | 0.386 | 0.386 | 0.364 | 0.365 | 0.399 | 0.402 | 0.443 |
| 1990 | 0.505 | 0.424 | 0.388 | 0.350 | 0.335 | 0.300 | 0.302 | 0.454 | 0.543 | 0.555 | 0.563 | 0.547 |
| 1991 | 0.515 | 0.381 | 0.319 | 0.287 | 0.289 | 0.274 | 0.296 | 0.295 | 0.306 | 0.330 | 0.344 | 0.340 |
| 1992 | 0.267 | 0.266 | 0.271 | 0.291 | 0.346 | 0.346 | 0.366 | 0.396 | 0.393 | 0.427 | 0.428 | 0.402 |
| 1993 | 0.396 | NA | NA | 0.367 | 0.391 | 0.356 | 0.328 | 0.329 | 0.323 | 0.328 | 0.301 | 0.302 |
| 1994 | 0.324 | 0.367 | 0.339 | 0.304 | 0.320 | 0.326 | 0.361 | 0.376 | 0.332 | 0.328 | 0.365 | 0.386 |
| 1995 | 0.414 | 0.397 | 0.410 | 0.408 | 0.420 | 0.423 | 0.368 | 0.356 | 0.362 | 0.357 | 0.365 | 0.415 |
| 1996 | 0.493 | 0.435 | 0.442 | 0.441 | 0.416 | 0.407 | 0.399 | 0.422 | 0.458 | 0.524 | 0.504 | 0.503 |
| 1997 | 0.454 | 0.441 | 0.381 | 0.377 | 0.375 | 0.368 | 0.374 | 0.390 | 0.401 | 0.434 | 0.456 | 0.380 |
| 1998 | 0.330 | 0.307 | 0.274 | 0.311 | 0.315 | 0.297 | 0.297 | 0.274 | 0.250 | 0.271 | 0.281 | 0.240 |
| 1999 | 0.262 | 0.231 | 0.255 | 0.295 | 0.316 | 0.322 | 0.357 | 0.428 | 0.474 | 0.471 | 0.471 | 0.494 |
| 2000 | 0.490 | 0.523 | 0.542 | 0.524 | 0.503 | 0.557 | 0.582 | 0.528 | 0.588 | 0.646 | 0.585 | 0.603 |
| 2001 | 0.579 | 0.532 | 0.510 | 0.499 | 0.507 | 0.478 | 0.460 | 0.474 | 0.512 | 0.467 | 0.432 | 0.387 |
| 2002 | 0.400 | 0.400 | 0.486 | 0.553 | 0.557 | 0.550 | 0.549 | 0.589 | 0.613 | 0.636 | 0.533 | 0.579 |
| 2003 | 0.732 | 0.796 | 0.773 | 0.585 | 0.565 | 0.576 | 0.685 | 0.685 | 0.617 | 0.633 | 0.639 | 0.613 |
| 2004 | 0.648 | 0.647 | 0.613 | 0.638 | 0.709 | 0.697 | 0.673 | 0.712 | 0.716 | 0.807 | 0.729 | 0.688 |
| 2005 | 0.735 | 0.766 | 0.825 | 0.948 | 0.989 | 0.967 | 0.980 | 1.028 | 1.180 | 1.216 | 1.078 | 1.143 |
| 2006 | 1.176 | 1.189 | 1.202 | 1.228 | 1.261 | 1.246 | 1.233 | 1.271 | 1.130 | 1.050 | 1.071 | 1.067 |
| 2007 | 0.980 | 1.027 | 1.081 | 1.160 | 1.301 | 1.321 | 1.380 | 1.417 | 1.413 | 1.559 | 1.829 | 1.797 |
| 2008 | 1.786 | 1.723 | 1.831 | 1.869 | 2.035 | 2.276 | 2.642 | 2.472 | 2.215 | 1.717 | 1.008 | 0.849 |
| 2009 | 0.887 | 0.965 | 0.946 | 1.021 | 1.185 | 1.403 | 1.400 | 1.521 | 1.521 | 1.562 | 1.686 | 1.668 |
| 2010 | 1.720 | 1.646 | 1.695 | 1.751 | 1.684 | 1.593 | 1.622 | 1.642 | 1.638 | 1.683 | 1.752 | 1.797 |
| 2011 | 1.891 | 2.008 | - | - | - | - | - | - | - | - | - | - |
| 2012 | - | - | - | - | - | - | - | - | - | - | - | - |
| 2013 | - | - | - | - | - | - | - | - | - | - | - | - |
| 2014 | - | - | - | - | - | - | - | - | - | - | - | - |
| 2015 | - | - | - | - | - | - | - | - | - | - | - | - |
| 2016 | - | - | - | - | - | - | - | - | - | - | - | - |
| 2017 | - | - | - | - | - | - | - | - | - | - | - | - |
| 2018 | - | - | - | - | - | - | - | - | - | - | - | - |
| 2019 | - | - | - | - | - | - | - | - | - | - | - | - |
| 2020 | - | - | - | - | - | - | - | - | - | - | - | - |
| 2021 | - | - | - | - | - | - | - | - | - | - | - | - |
| 2022 | - | - | - | |||||||||
| - = No Data Reported; -- = Not Applicable; NA = Not Available; W = Withheld to avoid disclosure of individual company data. |
| Release Date: 6/1/2022 |
| Next Release Date: TBD |