|
Download Data (XLS File) |
|
||||||||
|
||||||||
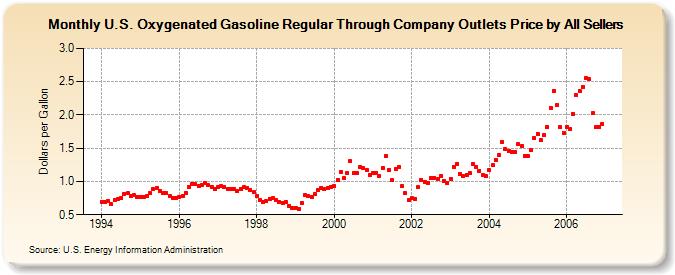
| U.S. Oxygenated Gasoline Regular Through Company Outlets Price by All Sellers (Dollars per Gallon) | ||||||||
| Year | Jan | Feb | Mar | Apr | May | Jun | Jul | Aug | Sep | Oct | Nov | Dec |
|---|---|---|---|---|---|---|---|---|---|---|---|---|
| 1994 | 0.698 | 0.690 | 0.711 | 0.657 | 0.716 | 0.730 | 0.755 | 0.816 | 0.819 | 0.784 | 0.792 | 0.772 |
| 1995 | 0.770 | 0.763 | 0.781 | 0.826 | 0.879 | 0.902 | 0.863 | 0.828 | 0.824 | 0.779 | 0.756 | 0.757 |
| 1996 | 0.770 | 0.781 | 0.833 | 0.921 | 0.968 | 0.956 | 0.938 | 0.952 | 0.971 | 0.945 | 0.924 | 0.893 |
| 1997 | 0.910 | 0.931 | 0.917 | 0.883 | 0.894 | 0.885 | 0.862 | 0.893 | 0.913 | 0.907 | 0.878 | 0.835 |
| 1998 | 0.777 | 0.718 | 0.684 | 0.700 | 0.743 | 0.747 | 0.722 | 0.690 | 0.679 | 0.694 | 0.636 | 0.604 |
| 1999 | 0.601 | 0.585 | 0.677 | 0.790 | 0.781 | 0.772 | 0.814 | 0.874 | 0.907 | 0.888 | 0.903 | 0.917 |
| 2000 | 0.933 | 1.019 | 1.145 | 1.050 | 1.122 | 1.302 | 1.126 | 1.130 | 1.224 | 1.199 | 1.173 | 1.101 |
| 2001 | 1.129 | 1.130 | 1.084 | 1.205 | 1.379 | 1.179 | 1.015 | 1.189 | 1.224 | 0.925 | 0.822 | 0.718 |
| 2002 | 0.744 | 0.740 | 0.915 | 1.025 | 0.997 | 0.982 | 1.053 | 1.059 | 1.036 | 1.086 | 1.010 | 0.972 |
| 2003 | 1.044 | 1.224 | 1.268 | 1.117 | 1.084 | 1.099 | 1.126 | 1.264 | 1.214 | 1.162 | 1.104 | 1.077 |
| 2004 | 1.172 | 1.244 | 1.329 | 1.399 | 1.598 | 1.487 | 1.460 | 1.439 | 1.446 | 1.562 | 1.534 | 1.386 |
| 2005 | 1.377 | 1.474 | 1.655 | 1.717 | 1.618 | 1.691 | 1.815 | 2.104 | 2.366 | 2.148 | 1.812 | 1.735 |
| 2006 | 1.820 | 1.781 | 2.014 | 2.298 | 2.364 | 2.422 | 2.556 | 2.535 | 2.023 | 1.812 | 1.821 | 1.871 |
| - = No Data Reported; -- = Not Applicable; NA = Not Available; W = Withheld to avoid disclosure of individual company data. |
| Release Date: 6/1/2022 |
| Next Release Date: TBD |