|
Download Data (XLS File) |
|
||||||||
|
||||||||
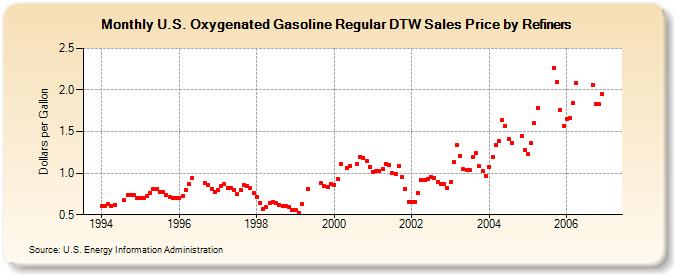
| U.S. Oxygenated Gasoline Regular DTW Sales Price by Refiners (Dollars per Gallon) | ||||||||
| Year | Jan | Feb | Mar | Apr | May | Jun | Jul | Aug | Sep | Oct | Nov | Dec |
|---|---|---|---|---|---|---|---|---|---|---|---|---|
| 1994 | 0.600 | 0.601 | 0.626 | 0.608 | 0.619 | W | W | 0.676 | 0.741 | 0.735 | 0.734 | 0.701 |
| 1995 | 0.695 | 0.699 | 0.724 | 0.767 | 0.804 | 0.804 | 0.779 | 0.768 | 0.743 | 0.709 | 0.699 | 0.697 |
| 1996 | 0.704 | 0.723 | 0.795 | 0.872 | 0.943 | NA | NA | NA | 0.884 | 0.854 | 0.808 | 0.770 |
| 1997 | 0.800 | 0.850 | 0.864 | 0.821 | 0.825 | 0.801 | 0.751 | 0.799 | 0.854 | 0.846 | 0.817 | 0.765 |
| 1998 | 0.713 | 0.641 | 0.563 | 0.588 | 0.644 | 0.647 | 0.639 | 0.614 | 0.610 | 0.602 | 0.590 | 0.562 |
| 1999 | 0.552 | 0.522 | 0.625 | NA | 0.812 | W | W | W | 0.881 | 0.842 | 0.839 | 0.864 |
| 2000 | 0.862 | 0.928 | 1.115 | NA | 1.061 | 1.088 | NA | 1.110 | 1.198 | 1.183 | 1.147 | 1.075 |
| 2001 | 1.019 | 1.022 | 1.020 | 1.051 | 1.115 | 1.100 | 1.000 | 0.993 | 1.090 | 0.957 | 0.815 | 0.658 |
| 2002 | 0.657 | 0.657 | 0.757 | 0.915 | 0.913 | 0.929 | 0.953 | 0.940 | 0.895 | 0.868 | 0.864 | 0.826 |
| 2003 | 0.890 | 1.135 | 1.338 | 1.203 | 1.049 | 1.037 | 1.037 | 1.191 | 1.244 | 1.080 | 1.028 | 0.968 |
| 2004 | 1.077 | 1.200 | 1.335 | 1.383 | 1.633 | 1.565 | 1.406 | 1.367 | NA | NA | 1.448 | 1.278 |
| 2005 | 1.225 | 1.363 | 1.597 | 1.782 | W | W | W | W | 2.263 | 2.095 | 1.760 | 1.567 |
| 2006 | 1.656 | 1.659 | 1.839 | 2.085 | - | - | - | - | 2.064 | 1.832 | 1.831 | 1.952 |
| - = No Data Reported; -- = Not Applicable; NA = Not Available; W = Withheld to avoid disclosure of individual company data. |
| Release Date: 6/1/2022 |
| Next Release Date: TBD |
Referring Pages: