|
Download Data (XLS File) |
|
||||||||
|
||||||||
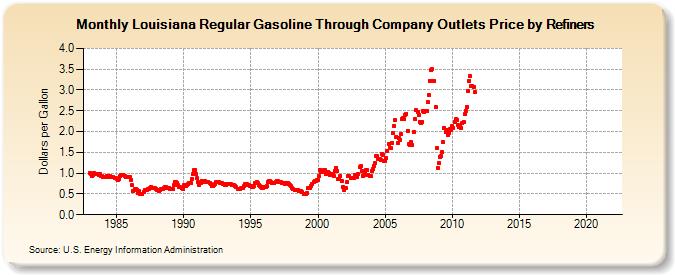
| Louisiana Regular Gasoline Through Company Outlets Price by Refiners (Dollars per Gallon) | ||||||||
| Year | Jan | Feb | Mar | Apr | May | Jun | Jul | Aug | Sep | Oct | Nov | Dec |
|---|---|---|---|---|---|---|---|---|---|---|---|---|
| 1983 | 0.998 | 0.969 | 0.929 | 0.949 | 0.992 | 0.991 | 0.989 | 0.969 | 0.966 | 0.968 | 0.932 | 0.930 |
| 1984 | 0.902 | 0.906 | 0.910 | 0.929 | 0.928 | 0.914 | 0.928 | 0.910 | 0.901 | 0.898 | 0.889 | 0.887 |
| 1985 | 0.856 | 0.837 | 0.855 | 0.920 | 0.946 | 0.958 | 0.950 | 0.942 | 0.905 | 0.916 | 0.911 | 0.913 |
| 1986 | 0.899 | 0.845 | 0.704 | 0.576 | 0.610 | 0.630 | 0.601 | 0.528 | 0.559 | 0.503 | 0.499 | 0.506 |
| 1987 | 0.548 | 0.590 | 0.591 | 0.600 | 0.621 | 0.625 | 0.634 | 0.670 | 0.647 | 0.643 | 0.637 | 0.623 |
| 1988 | 0.602 | 0.586 | 0.568 | 0.586 | 0.613 | 0.611 | 0.635 | 0.668 | 0.657 | 0.653 | 0.649 | 0.640 |
| 1989 | 0.628 | 0.619 | 0.621 | 0.711 | 0.782 | 0.782 | 0.763 | 0.709 | 0.668 | 0.660 | 0.642 | 0.629 |
| 1990 | 0.704 | 0.708 | 0.700 | 0.711 | 0.732 | 0.764 | 0.754 | 0.864 | 0.973 | 1.075 | 1.072 | 0.985 |
| 1991 | 0.871 | 0.790 | 0.725 | 0.753 | 0.817 | 0.821 | 0.798 | 0.804 | 0.796 | 0.778 | 0.784 | 0.768 |
| 1992 | 0.727 | 0.695 | 0.692 | 0.708 | 0.744 | 0.783 | 0.791 | 0.782 | 0.771 | 0.763 | 0.760 | 0.746 |
| 1993 | 0.733 | 0.713 | 0.715 | 0.731 | 0.736 | 0.740 | 0.730 | 0.720 | 0.713 | 0.709 | 0.691 | 0.658 |
| 1994 | 0.626 | 0.623 | 0.610 | 0.633 | 0.641 | 0.654 | 0.680 | 0.727 | 0.733 | 0.712 | 0.717 | 0.700 |
| 1995 | 0.691 | 0.674 | 0.663 | 0.694 | 0.766 | 0.786 | 0.759 | 0.717 | 0.695 | 0.676 | 0.653 | 0.647 |
| 1996 | 0.660 | 0.657 | 0.695 | 0.792 | 0.819 | 0.803 | 0.776 | 0.756 | 0.753 | 0.762 | 0.791 | 0.801 |
| 1997 | 0.801 | 0.797 | 0.790 | 0.783 | 0.773 | 0.765 | 0.734 | 0.763 | 0.768 | 0.755 | 0.738 | 0.712 |
| 1998 | 0.681 | 0.640 | 0.612 | 0.604 | 0.605 | 0.604 | 0.600 | 0.574 | 0.560 | 0.561 | 0.544 | 0.502 |
| 1999 | 0.495 | 0.493 | 0.528 | 0.637 | 0.654 | 0.653 | 0.689 | 0.750 | 0.783 | 0.809 | 0.809 | 0.836 |
| 2000 | 0.845 | 0.928 | 1.070 | 1.022 | 1.016 | 1.071 | 1.064 | 0.980 | 1.036 | 1.019 | 1.002 | 0.945 |
| 2001 | 0.978 | 0.991 | 0.938 | 1.060 | 1.128 | 1.040 | 0.857 | 0.863 | 0.935 | 0.800 | 0.671 | 0.601 |
| 2002 | 0.637 | 0.634 | 0.779 | 0.932 | 0.920 | 0.889 | 0.886 | 0.880 | 0.889 | 0.957 | 0.941 | 0.911 |
| 2003 | 0.984 | 1.136 | 1.160 | 1.049 | 0.938 | 0.948 | 0.992 | 1.087 | 1.066 | 0.961 | 0.935 | 0.941 |
| 2004 | 1.061 | 1.107 | 1.182 | 1.242 | 1.418 | 1.403 | 1.345 | 1.343 | 1.324 | 1.467 | 1.447 | 1.294 |
| 2005 | 1.292 | 1.359 | 1.536 | 1.708 | 1.612 | 1.597 | 1.723 | 1.959 | 2.142 | 2.270 | 1.875 | 1.730 |
| 2006 | 1.835 | 1.800 | 1.941 | 2.303 | 2.327 | 2.298 | 2.410 | 2.434 | 2.024 | 1.690 | 1.668 | 1.743 |
| 2007 | 1.671 | NA | 1.994 | 2.290 | 2.507 | 2.478 | 2.408 | 2.227 | 2.215 | 2.232 | 2.506 | 2.462 |
| 2008 | 2.499 | 2.502 | 2.699 | 2.887 | 3.225 | 3.469 | 3.501 | 3.227 | 3.213 | 2.588 | 1.599 | 1.134 |
| 2009 | 1.233 | 1.385 | 1.416 | 1.506 | 1.745 | 2.087 | 1.981 | 2.035 | 1.919 | 1.964 | 2.059 | 2.030 |
| 2010 | 2.139 | 2.082 | 2.235 | 2.293 | 2.281 | 2.151 | 2.111 | 2.128 | 2.096 | 2.202 | 2.236 | 2.412 |
| 2011 | 2.503 | 2.592 | 2.980 | 3.219 | 3.324 | 3.086 | 3.106 | 3.060 | 2.957 | W | W | W |
| 2012 | W | W | W | W | W | W | W | W | W | W | W | W |
| 2013 | W | W | W | W | - | - | - | - | - | - | - | - |
| 2014 | - | - | - | - | - | - | - | - | - | - | - | - |
| 2015 | - | - | - | - | - | - | - | - | - | - | - | - |
| 2016 | - | - | - | - | - | - | - | - | - | - | - | - |
| 2017 | - | - | - | - | - | - | - | - | - | - | - | - |
| 2018 | - | - | - | - | - | - | - | - | - | - | - | - |
| 2019 | - | - | - | - | - | - | - | - | - | - | - | - |
| 2020 | - | - | - | - | - | - | - | - | - | - | - | - |
| 2021 | - | - | - | - | - | - | - | - | - | - | - | - |
| 2022 | - | - | - | |||||||||
| - = No Data Reported; -- = Not Applicable; NA = Not Available; W = Withheld to avoid disclosure of individual company data. |
| Release Date: 6/1/2022 |
| Next Release Date: TBD |