|
Download Data (XLS File) |
|
||||||||
|
||||||||
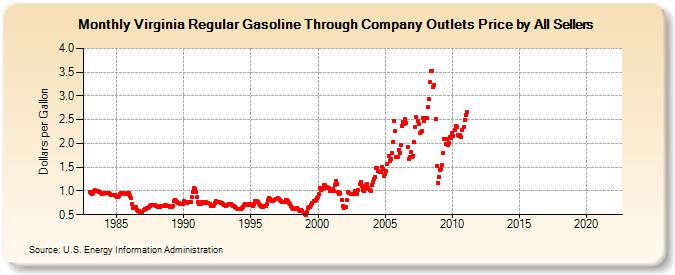
| Virginia Regular Gasoline Through Company Outlets Price by All Sellers (Dollars per Gallon) | ||||||||
| Year | Jan | Feb | Mar | Apr | May | Jun | Jul | Aug | Sep | Oct | Nov | Dec |
|---|---|---|---|---|---|---|---|---|---|---|---|---|
| 1983 | 0.987 | 0.948 | 0.926 | 0.958 | 1.002 | 1.010 | 0.999 | 0.996 | 0.986 | 0.975 | 0.960 | 0.941 |
| 1984 | 0.932 | 0.948 | 0.952 | 0.951 | 0.949 | 0.949 | 0.928 | 0.918 | 0.918 | 0.920 | 0.907 | 0.893 |
| 1985 | 0.873 | 0.869 | 0.902 | 0.941 | 0.959 | 0.958 | 0.947 | 0.938 | 0.937 | 0.952 | 0.960 | 0.967 |
| 1986 | 0.903 | 0.843 | 0.729 | 0.642 | 0.659 | 0.653 | 0.590 | 0.573 | 0.568 | 0.546 | 0.540 | 0.547 |
| 1987 | 0.600 | 0.615 | 0.630 | 0.647 | 0.650 | 0.667 | 0.681 | 0.703 | 0.707 | 0.701 | 0.703 | 0.687 |
| 1988 | 0.679 | 0.668 | 0.660 | 0.665 | 0.677 | 0.677 | 0.693 | 0.700 | 0.694 | 0.687 | 0.688 | 0.684 |
| 1989 | 0.669 | 0.671 | 0.693 | 0.792 | 0.818 | 0.787 | 0.775 | 0.756 | 0.740 | 0.732 | 0.723 | 0.730 |
| 1990 | 0.783 | 0.762 | 0.744 | 0.751 | 0.760 | 0.768 | 0.763 | 0.883 | 0.974 | 1.052 | 1.039 | 0.977 |
| 1991 | 0.870 | 0.770 | 0.725 | 0.726 | 0.770 | 0.769 | 0.747 | 0.761 | 0.763 | 0.739 | 0.753 | 0.728 |
| 1992 | 0.690 | 0.676 | 0.677 | 0.703 | 0.744 | 0.781 | 0.774 | 0.767 | 0.762 | 0.750 | 0.745 | 0.721 |
| 1993 | 0.710 | 0.696 | 0.691 | 0.714 | 0.731 | 0.729 | 0.722 | 0.701 | 0.689 | 0.683 | 0.670 | 0.633 |
| 1994 | 0.615 | 0.616 | 0.611 | 0.624 | 0.633 | 0.659 | 0.704 | 0.715 | 0.710 | 0.701 | 0.728 | 0.722 |
| 1995 | 0.712 | 0.700 | 0.683 | 0.720 | 0.782 | 0.789 | 0.758 | 0.723 | 0.706 | 0.688 | 0.665 | 0.668 |
| 1996 | 0.680 | 0.683 | 0.725 | 0.819 | 0.855 | 0.832 | 0.816 | 0.796 | 0.793 | 0.803 | 0.833 | 0.840 |
| 1997 | 0.842 | 0.827 | 0.808 | 0.785 | 0.777 | 0.766 | 0.760 | 0.806 | 0.807 | 0.782 | 0.746 | 0.721 |
| 1998 | 0.675 | 0.638 | 0.616 | 0.626 | 0.640 | 0.635 | 0.626 | 0.602 | 0.584 | 0.592 | 0.575 | 0.530 |
| 1999 | 0.523 | 0.504 | 0.553 | 0.646 | 0.658 | 0.654 | 0.701 | 0.752 | 0.793 | 0.795 | 0.810 | 0.850 |
| 2000 | 0.867 | 0.929 | 1.064 | 1.014 | 1.050 | 1.124 | 1.130 | 1.069 | 1.082 | 1.072 | 1.058 | 1.000 |
| 2001 | 1.030 | 1.043 | 0.996 | 1.130 | 1.208 | 1.138 | 0.981 | 0.934 | 0.953 | 0.808 | 0.683 | 0.634 |
| 2002 | 0.667 | 0.662 | 0.802 | 0.970 | 0.961 | 0.933 | 0.932 | 0.931 | 0.934 | 0.994 | 0.962 | 0.944 |
| 2003 | 1.022 | 1.154 | 1.192 | 1.107 | 1.012 | 1.003 | 1.041 | 1.132 | 1.144 | 1.067 | 1.018 | 1.000 |
| 2004 | 1.121 | 1.178 | 1.245 | 1.303 | 1.478 | 1.478 | 1.417 | 1.401 | 1.394 | 1.505 | 1.452 | 1.311 |
| 2005 | 1.349 | 1.410 | 1.573 | 1.741 | 1.636 | 1.669 | 1.802 | 2.038 | 2.470 | 2.260 | 1.706 | 1.706 |
| 2006 | 1.870 | 1.797 | 1.957 | 2.375 | 2.442 | 2.414 | 2.505 | 2.430 | 1.926 | 1.670 | 1.705 | 1.817 |
| 2007 | 1.713 | 1.744 | 2.031 | 2.342 | 2.555 | 2.480 | 2.410 | 2.221 | 2.244 | 2.259 | 2.542 | 2.479 |
| 2008 | 2.543 | 2.543 | 2.769 | 2.940 | 3.287 | 3.531 | 3.534 | 3.191 | 3.232 | 2.521 | 1.530 | 1.173 |
| 2009 | 1.295 | 1.432 | 1.465 | 1.552 | 1.795 | 2.101 | 1.985 | 2.084 | 1.970 | 2.015 | 2.138 | 2.107 |
| 2010 | 2.224 | 2.156 | 2.288 | 2.367 | 2.343 | 2.184 | 2.163 | 2.182 | 2.136 | 2.275 | 2.337 | 2.499 |
| 2011 | 2.596 | 2.663 | - | - | - | - | - | - | - | - | - | - |
| 2012 | - | - | - | - | - | - | - | - | - | - | - | - |
| 2013 | - | - | - | - | - | - | - | - | - | - | - | - |
| 2014 | - | - | - | - | - | - | - | - | - | - | - | - |
| 2015 | - | - | - | - | - | - | - | - | - | - | - | - |
| 2016 | - | - | - | - | - | - | - | - | - | - | - | - |
| 2017 | - | - | - | - | - | - | - | - | - | - | - | - |
| 2018 | - | - | - | - | - | - | - | - | - | - | - | - |
| 2019 | - | - | - | - | - | - | - | - | - | - | - | - |
| 2020 | - | - | - | - | - | - | - | - | - | - | - | - |
| 2021 | - | - | - | - | - | - | - | - | - | - | - | - |
| 2022 | - | - | - | |||||||||
| - = No Data Reported; -- = Not Applicable; NA = Not Available; W = Withheld to avoid disclosure of individual company data. |
| Release Date: 6/1/2022 |
| Next Release Date: TBD |