|
Download Data (XLS File) |
|
||||||||
|
||||||||
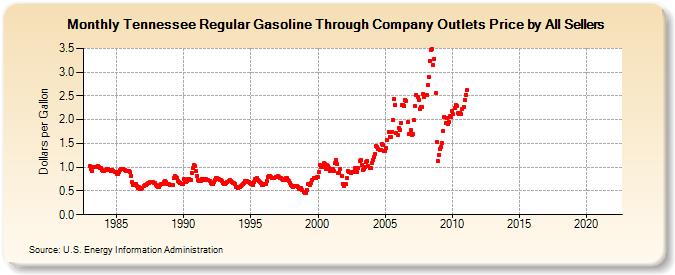
| Tennessee Regular Gasoline Through Company Outlets Price by All Sellers (Dollars per Gallon) | ||||||||
| Year | Jan | Feb | Mar | Apr | May | Jun | Jul | Aug | Sep | Oct | Nov | Dec |
|---|---|---|---|---|---|---|---|---|---|---|---|---|
| 1983 | 1.019 | 0.958 | 0.929 | 1.001 | 1.006 | 1.008 | 1.005 | 1.027 | 1.014 | 0.992 | 0.978 | 0.944 |
| 1984 | 0.923 | 0.930 | 0.937 | 0.960 | 0.954 | 0.940 | 0.934 | 0.925 | 0.937 | 0.927 | 0.908 | 0.896 |
| 1985 | 0.858 | 0.856 | 0.906 | 0.933 | 0.960 | 0.955 | 0.961 | 0.946 | 0.911 | 0.915 | 0.927 | 0.928 |
| 1986 | 0.894 | 0.821 | 0.680 | 0.618 | 0.639 | 0.644 | 0.594 | 0.567 | 0.580 | 0.540 | 0.545 | 0.555 |
| 1987 | 0.594 | 0.618 | 0.622 | 0.639 | 0.657 | 0.671 | 0.680 | 0.692 | 0.680 | 0.672 | 0.660 | 0.626 |
| 1988 | 0.599 | 0.586 | 0.580 | 0.635 | 0.651 | 0.656 | 0.686 | 0.702 | 0.682 | 0.655 | 0.645 | 0.638 |
| 1989 | 0.624 | 0.617 | 0.634 | 0.774 | 0.810 | 0.798 | 0.771 | 0.710 | 0.678 | 0.665 | 0.649 | 0.653 |
| 1990 | 0.744 | 0.723 | 0.678 | 0.701 | 0.743 | 0.760 | 0.735 | 0.876 | 0.980 | 1.039 | 1.021 | 0.911 |
| 1991 | 0.813 | 0.729 | 0.700 | 0.717 | 0.761 | 0.757 | 0.736 | 0.752 | 0.751 | 0.731 | 0.734 | 0.717 |
| 1992 | 0.664 | 0.638 | 0.648 | 0.686 | 0.737 | 0.768 | 0.764 | 0.747 | 0.741 | 0.720 | 0.713 | 0.674 |
| 1993 | 0.653 | 0.645 | 0.661 | 0.693 | 0.717 | 0.722 | 0.701 | 0.685 | 0.674 | 0.668 | 0.638 | 0.589 |
| 1994 | 0.561 | 0.581 | 0.581 | 0.610 | 0.616 | 0.639 | 0.662 | 0.713 | 0.704 | 0.683 | 0.689 | 0.664 |
| 1995 | 0.642 | 0.645 | 0.631 | 0.692 | 0.760 | 0.765 | 0.731 | 0.700 | 0.681 | 0.658 | 0.620 | 0.619 |
| 1996 | 0.649 | 0.652 | 0.710 | 0.800 | 0.821 | 0.805 | 0.789 | 0.775 | 0.771 | 0.773 | 0.800 | 0.802 |
| 1997 | 0.805 | 0.799 | 0.778 | 0.769 | 0.753 | 0.738 | 0.724 | 0.768 | 0.764 | 0.736 | 0.707 | 0.672 |
| 1998 | 0.629 | 0.611 | 0.592 | 0.601 | 0.609 | 0.599 | 0.588 | 0.551 | 0.537 | 0.564 | 0.518 | 0.469 |
| 1999 | 0.464 | 0.457 | 0.527 | 0.640 | 0.638 | 0.628 | 0.674 | 0.732 | 0.773 | 0.771 | 0.772 | 0.790 |
| 2000 | 0.798 | 0.894 | 1.046 | 1.004 | 1.007 | 1.081 | 1.067 | 0.972 | 1.038 | 1.025 | 0.993 | 0.920 |
| 2001 | 0.962 | 0.967 | 0.926 | 1.079 | 1.146 | 1.074 | 0.881 | 0.881 | 0.970 | 0.810 | 0.654 | 0.605 |
| 2002 | 0.652 | 0.640 | 0.775 | 0.914 | 0.891 | 0.878 | 0.897 | 0.890 | 0.901 | 0.983 | 0.940 | 0.898 |
| 2003 | 0.981 | 1.135 | 1.160 | 1.052 | 0.949 | 0.969 | 1.004 | 1.108 | 1.124 | 1.016 | 0.977 | 0.975 |
| 2004 | 1.096 | 1.150 | 1.212 | 1.284 | 1.438 | 1.435 | 1.374 | 1.356 | 1.361 | 1.491 | 1.471 | 1.340 |
| 2005 | 1.344 | 1.398 | 1.574 | 1.750 | 1.634 | 1.629 | 1.748 | 2.003 | 2.445 | 2.314 | 1.720 | 1.670 |
| 2006 | 1.826 | 1.773 | 1.938 | 2.310 | 2.307 | 2.292 | 2.414 | 2.402 | 1.943 | 1.690 | 1.693 | 1.789 |
| 2007 | 1.675 | 1.701 | 1.987 | 2.289 | 2.527 | 2.474 | 2.404 | 2.221 | 2.257 | 2.268 | 2.536 | 2.475 |
| 2008 | 2.514 | 2.520 | 2.723 | 2.892 | 3.243 | 3.466 | 3.487 | 3.160 | 3.285 | 2.557 | 1.530 | 1.132 |
| 2009 | 1.262 | 1.393 | 1.424 | 1.510 | 1.763 | 2.058 | 1.940 | 2.025 | 1.914 | 1.961 | 2.070 | 2.049 |
| 2010 | 2.182 | 2.109 | 2.246 | 2.309 | 2.288 | 2.136 | 2.119 | 2.141 | 2.113 | 2.220 | 2.268 | 2.420 |
| 2011 | 2.527 | 2.620 | - | - | - | - | - | - | - | - | - | - |
| 2012 | - | - | - | - | - | - | - | - | - | - | - | - |
| 2013 | - | - | - | - | - | - | - | - | - | - | - | - |
| 2014 | - | - | - | - | - | - | - | - | - | - | - | - |
| 2015 | - | - | - | - | - | - | - | - | - | - | - | - |
| 2016 | - | - | - | - | - | - | - | - | - | - | - | - |
| 2017 | - | - | - | - | - | - | - | - | - | - | - | - |
| 2018 | - | - | - | - | - | - | - | - | - | - | - | - |
| 2019 | - | - | - | - | - | - | - | - | - | - | - | - |
| 2020 | - | - | - | - | - | - | - | - | - | - | - | - |
| 2021 | - | - | - | - | - | - | - | - | - | - | - | - |
| 2022 | - | - | - | |||||||||
| - = No Data Reported; -- = Not Applicable; NA = Not Available; W = Withheld to avoid disclosure of individual company data. |
| Release Date: 6/1/2022 |
| Next Release Date: TBD |