|
Download Data (XLS File) |
|
||||||||
|
||||||||
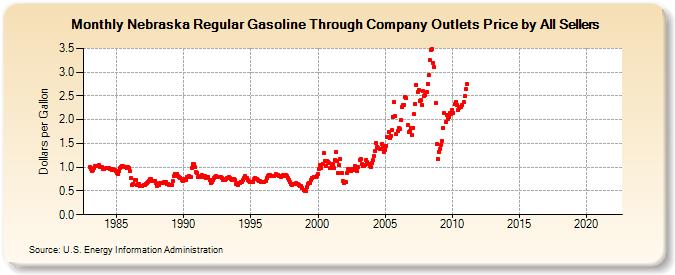
| Nebraska Regular Gasoline Through Company Outlets Price by All Sellers (Dollars per Gallon) | ||||||||
| Year | Jan | Feb | Mar | Apr | May | Jun | Jul | Aug | Sep | Oct | Nov | Dec |
|---|---|---|---|---|---|---|---|---|---|---|---|---|
| 1983 | 0.998 | 0.953 | 0.927 | 0.937 | 0.991 | 1.023 | 1.021 | 1.035 | 1.036 | 1.013 | 0.994 | 0.994 |
| 1984 | 0.968 | 0.971 | 0.977 | 0.987 | 0.990 | 0.974 | 0.960 | 0.952 | 0.951 | 0.954 | 0.947 | 0.919 |
| 1985 | 0.870 | 0.865 | 0.914 | 0.979 | 1.001 | 1.025 | 1.026 | 1.008 | 0.999 | 0.983 | 0.996 | 0.988 |
| 1986 | 0.912 | 0.768 | 0.632 | 0.652 | 0.729 | 0.732 | 0.631 | 0.638 | 0.640 | 0.609 | 0.606 | 0.601 |
| 1987 | 0.621 | 0.626 | 0.653 | 0.675 | 0.697 | 0.716 | 0.745 | 0.743 | 0.717 | 0.705 | 0.705 | 0.658 |
| 1988 | 0.608 | 0.616 | 0.625 | 0.658 | 0.663 | 0.657 | 0.688 | 0.694 | 0.682 | 0.656 | 0.653 | 0.635 |
| 1989 | 0.620 | 0.635 | 0.702 | 0.818 | 0.862 | 0.866 | 0.860 | 0.806 | 0.790 | 0.778 | 0.741 | 0.712 |
| 1990 | 0.756 | 0.741 | 0.729 | 0.792 | 0.802 | 0.807 | 0.785 | 0.986 | 1.063 | 1.060 | 1.002 | 0.904 |
| 1991 | 0.873 | 0.799 | 0.787 | 0.813 | 0.829 | 0.801 | 0.796 | 0.805 | 0.764 | 0.765 | 0.784 | 0.721 |
| 1992 | 0.663 | 0.684 | 0.722 | 0.764 | 0.800 | 0.808 | 0.786 | 0.784 | 0.794 | 0.789 | 0.771 | 0.735 |
| 1993 | 0.721 | 0.722 | 0.757 | 0.776 | 0.789 | 0.782 | 0.748 | 0.737 | 0.736 | 0.751 | 0.727 | 0.644 |
| 1994 | 0.634 | 0.669 | 0.676 | 0.689 | 0.692 | 0.721 | 0.769 | 0.814 | 0.782 | 0.732 | 0.716 | 0.681 |
| 1995 | 0.680 | 0.687 | 0.697 | 0.743 | 0.779 | 0.758 | 0.723 | 0.715 | 0.711 | 0.687 | 0.678 | 0.687 |
| 1996 | 0.692 | 0.712 | 0.767 | 0.821 | 0.838 | 0.835 | 0.807 | 0.808 | 0.821 | 0.823 | 0.850 | 0.841 |
| 1997 | 0.840 | 0.820 | 0.813 | 0.784 | 0.818 | 0.826 | 0.808 | 0.830 | 0.812 | 0.770 | 0.738 | 0.698 |
| 1998 | 0.642 | 0.629 | 0.644 | 0.643 | 0.657 | 0.646 | 0.645 | 0.625 | 0.614 | 0.606 | 0.564 | 0.511 |
| 1999 | 0.508 | 0.499 | 0.576 | 0.655 | 0.664 | 0.667 | 0.726 | 0.773 | 0.801 | 0.790 | 0.787 | 0.813 |
| 2000 | 0.855 | 0.964 | 1.056 | 0.978 | 1.077 | 1.297 | 1.131 | 1.024 | 1.126 | 1.115 | 1.079 | 0.983 |
| 2001 | 1.035 | 1.067 | 0.986 | 1.155 | 1.317 | 1.123 | 0.879 | 1.041 | 1.179 | 0.879 | 0.716 | 0.658 |
| 2002 | 0.692 | 0.683 | 0.868 | 0.967 | 0.939 | 0.927 | 0.971 | 0.960 | 0.945 | 1.021 | 0.956 | 0.910 |
| 2003 | 0.995 | 1.151 | 1.170 | 1.062 | 1.027 | 1.028 | 1.046 | 1.154 | 1.107 | 1.073 | 1.022 | 0.997 |
| 2004 | 1.094 | 1.143 | 1.232 | 1.332 | 1.509 | 1.425 | 1.402 | 1.381 | 1.380 | 1.497 | 1.455 | 1.318 |
| 2005 | 1.370 | 1.456 | 1.638 | 1.734 | 1.606 | 1.663 | 1.779 | 2.062 | 2.368 | 2.071 | 1.691 | 1.760 |
| 2006 | 1.819 | 1.806 | 1.983 | 2.270 | 2.312 | 2.318 | 2.473 | 2.450 | 1.887 | 1.735 | 1.766 | 1.821 |
| 2007 | 1.671 | 1.829 | 2.113 | 2.333 | 2.740 | 2.580 | 2.622 | 2.395 | 2.412 | 2.318 | 2.597 | 2.494 |
| 2008 | 2.520 | 2.587 | 2.755 | 2.935 | 3.250 | 3.461 | 3.480 | 3.199 | 3.101 | 2.353 | 1.479 | 1.180 |
| 2009 | 1.326 | 1.387 | 1.468 | 1.544 | 1.828 | 2.144 | 1.947 | 2.098 | 2.012 | 2.061 | 2.145 | 2.122 |
| 2010 | 2.205 | 2.144 | 2.321 | 2.372 | 2.318 | 2.203 | 2.236 | 2.263 | 2.262 | 2.316 | 2.371 | 2.489 |
| 2011 | 2.639 | 2.741 | - | - | - | - | - | - | - | - | - | - |
| 2012 | - | - | - | - | - | - | - | - | - | - | - | - |
| 2013 | - | - | - | - | - | - | - | - | - | - | - | - |
| 2014 | - | - | - | - | - | - | - | - | - | - | - | - |
| 2015 | - | - | - | - | - | - | - | - | - | - | - | - |
| 2016 | - | - | - | - | - | - | - | - | - | - | - | - |
| 2017 | - | - | - | - | - | - | - | - | - | - | - | - |
| 2018 | - | - | - | - | - | - | - | - | - | - | - | - |
| 2019 | - | - | - | - | - | - | - | - | - | - | - | - |
| 2020 | - | - | - | - | - | - | - | - | - | - | - | - |
| 2021 | - | - | - | - | - | - | - | - | - | - | - | - |
| 2022 | - | - | - | |||||||||
| - = No Data Reported; -- = Not Applicable; NA = Not Available; W = Withheld to avoid disclosure of individual company data. |
| Release Date: 6/1/2022 |
| Next Release Date: TBD |