|
Download Data (XLS File) |
|
||||||||
|
||||||||
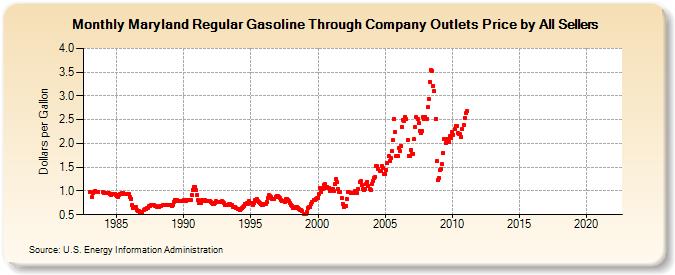
| Maryland Regular Gasoline Through Company Outlets Price by All Sellers (Dollars per Gallon) | ||||||||
| Year | Jan | Feb | Mar | Apr | May | Jun | Jul | Aug | Sep | Oct | Nov | Dec |
|---|---|---|---|---|---|---|---|---|---|---|---|---|
| 1983 | 0.979 | W | 0.866 | 0.949 | 0.984 | 1.008 | W | 0.988 | W | W | W | W |
| 1984 | 0.971 | 0.962 | 0.953 | 0.962 | 0.956 | 0.949 | 0.946 | 0.925 | 0.927 | 0.926 | 0.926 | 0.916 |
| 1985 | 0.884 | 0.879 | 0.921 | 0.936 | 0.941 | 0.947 | 0.958 | 0.932 | 0.939 | 0.931 | 0.943 | 0.931 |
| 1986 | 0.880 | 0.836 | 0.710 | 0.647 | 0.661 | 0.653 | 0.590 | 0.582 | 0.569 | 0.557 | 0.556 | 0.552 |
| 1987 | 0.593 | 0.611 | 0.619 | 0.635 | 0.646 | 0.686 | 0.693 | 0.701 | 0.704 | 0.699 | 0.692 | 0.680 |
| 1988 | 0.670 | 0.668 | 0.662 | 0.680 | 0.690 | 0.695 | 0.709 | 0.711 | 0.701 | 0.696 | 0.707 | 0.702 |
| 1989 | 0.699 | 0.693 | 0.702 | 0.775 | 0.817 | 0.817 | 0.808 | 0.787 | 0.786 | 0.788 | 0.784 | 0.782 |
| 1990 | 0.812 | 0.802 | 0.787 | 0.802 | 0.813 | 0.812 | 0.809 | 0.912 | 1.024 | 1.084 | 1.091 | 1.011 |
| 1991 | 0.917 | 0.813 | 0.737 | 0.754 | 0.803 | 0.806 | 0.783 | 0.801 | 0.799 | 0.782 | 0.795 | 0.790 |
| 1992 | 0.758 | 0.736 | 0.725 | 0.732 | 0.755 | 0.782 | 0.777 | 0.776 | 0.775 | 0.774 | 0.780 | 0.761 |
| 1993 | 0.740 | 0.713 | 0.700 | 0.701 | 0.716 | 0.719 | 0.708 | 0.701 | 0.670 | 0.666 | 0.667 | 0.632 |
| 1994 | 0.615 | 0.623 | 0.606 | 0.614 | 0.634 | 0.660 | 0.692 | 0.734 | 0.736 | 0.731 | 0.780 | 0.750 |
| 1995 | 0.757 | 0.740 | 0.712 | 0.743 | 0.809 | 0.826 | 0.793 | 0.764 | 0.744 | 0.717 | 0.696 | 0.714 |
| 1996 | 0.729 | 0.733 | 0.769 | 0.862 | 0.910 | 0.886 | 0.871 | 0.839 | 0.832 | 0.840 | 0.874 | 0.893 |
| 1997 | 0.893 | 0.864 | 0.842 | 0.806 | 0.794 | 0.781 | 0.778 | 0.831 | 0.839 | 0.808 | 0.780 | 0.748 |
| 1998 | 0.714 | 0.681 | 0.644 | 0.644 | 0.661 | 0.662 | 0.650 | 0.618 | 0.599 | 0.602 | 0.574 | 0.524 |
| 1999 | 0.522 | 0.506 | 0.552 | 0.642 | 0.661 | 0.661 | 0.718 | 0.771 | 0.811 | 0.818 | 0.837 | 0.855 |
| 2000 | 0.860 | 0.932 | 1.053 | 0.983 | 1.031 | 1.126 | 1.144 | 1.070 | 1.087 | 1.067 | 1.066 | 1.009 |
| 2001 | 1.034 | 1.048 | 1.005 | 1.137 | 1.245 | 1.184 | 1.043 | 0.979 | 0.982 | 0.855 | 0.726 | 0.665 |
| 2002 | 0.690 | 0.688 | 0.830 | 0.978 | 0.968 | 0.951 | 0.953 | 0.951 | 0.955 | 0.989 | 0.963 | 0.956 |
| 2003 | 1.047 | 1.180 | 1.203 | 1.124 | 1.034 | 1.023 | 1.048 | 1.150 | 1.195 | 1.114 | 1.048 | 1.025 |
| 2004 | 1.150 | 1.213 | 1.267 | 1.304 | 1.519 | 1.515 | 1.453 | 1.428 | 1.411 | 1.524 | 1.477 | 1.347 |
| 2005 | 1.366 | 1.436 | 1.580 | 1.730 | 1.631 | 1.696 | 1.831 | 2.064 | 2.517 | 2.251 | 1.739 | 1.734 |
| 2006 | 1.899 | 1.845 | 1.942 | 2.342 | 2.488 | 2.478 | 2.561 | 2.513 | 2.073 | 1.741 | 1.736 | 1.857 |
| 2007 | 1.777 | 1.784 | 2.083 | 2.343 | 2.546 | 2.522 | 2.440 | 2.271 | 2.228 | 2.264 | 2.555 | 2.510 |
| 2008 | 2.565 | 2.513 | 2.759 | 2.941 | 3.298 | 3.543 | 3.530 | 3.218 | 3.105 | 2.518 | 1.623 | 1.221 |
| 2009 | 1.275 | 1.431 | 1.469 | 1.557 | 1.798 | 2.097 | 2.006 | 2.095 | 2.026 | 2.031 | 2.159 | 2.123 |
| 2010 | 2.235 | 2.187 | 2.305 | 2.362 | 2.362 | 2.220 | 2.193 | 2.190 | 2.140 | 2.302 | 2.388 | 2.542 |
| 2011 | 2.631 | 2.672 | - | - | - | - | - | - | - | - | - | - |
| 2012 | - | - | - | - | - | - | - | - | - | - | - | - |
| 2013 | - | - | - | - | - | - | - | - | - | - | - | - |
| 2014 | - | - | - | - | - | - | - | - | - | - | - | - |
| 2015 | - | - | - | - | - | - | - | - | - | - | - | - |
| 2016 | - | - | - | - | - | - | - | - | - | - | - | - |
| 2017 | - | - | - | - | - | - | - | - | - | - | - | - |
| 2018 | - | - | - | - | - | - | - | - | - | - | - | - |
| 2019 | - | - | - | - | - | - | - | - | - | - | - | - |
| 2020 | - | - | - | - | - | - | - | - | - | - | - | - |
| 2021 | - | - | - | - | - | - | - | - | - | - | - | - |
| 2022 | - | - | - | |||||||||
| - = No Data Reported; -- = Not Applicable; NA = Not Available; W = Withheld to avoid disclosure of individual company data. |
| Release Date: 6/1/2022 |
| Next Release Date: TBD |