|
Download Data (XLS File) |
|
||||||||
|
||||||||
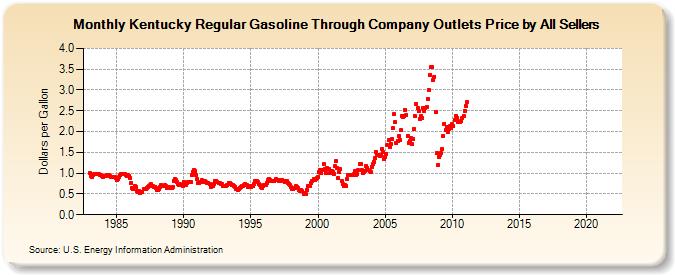
| Kentucky Regular Gasoline Through Company Outlets Price by All Sellers (Dollars per Gallon) | ||||||||
| Year | Jan | Feb | Mar | Apr | May | Jun | Jul | Aug | Sep | Oct | Nov | Dec |
|---|---|---|---|---|---|---|---|---|---|---|---|---|
| 1983 | 0.999 | 0.940 | 0.911 | 0.965 | 0.976 | 0.975 | 0.977 | 0.972 | 0.976 | 0.963 | 0.944 | 0.925 |
| 1984 | 0.915 | 0.924 | 0.922 | 0.952 | 0.967 | 0.946 | 0.924 | 0.919 | 0.914 | 0.919 | 0.905 | 0.872 |
| 1985 | 0.839 | 0.853 | 0.897 | 0.948 | 0.969 | 0.973 | 0.987 | 0.985 | 0.947 | 0.928 | 0.946 | 0.941 |
| 1986 | 0.884 | 0.765 | 0.652 | 0.607 | 0.686 | 0.672 | 0.570 | 0.547 | 0.562 | 0.524 | 0.543 | 0.544 |
| 1987 | 0.623 | 0.615 | 0.630 | 0.648 | 0.667 | 0.693 | 0.714 | 0.727 | 0.692 | 0.675 | 0.675 | 0.638 |
| 1988 | 0.598 | 0.593 | 0.608 | 0.659 | 0.705 | 0.689 | 0.692 | 0.709 | 0.681 | 0.649 | 0.669 | 0.655 |
| 1989 | 0.640 | 0.631 | 0.670 | 0.819 | 0.848 | 0.823 | 0.785 | 0.730 | 0.720 | 0.727 | 0.705 | 0.702 |
| 1990 | 0.792 | 0.757 | 0.722 | 0.767 | 0.793 | 0.795 | 0.782 | 0.948 | 1.031 | 1.085 | 1.042 | 0.950 |
| 1991 | 0.860 | 0.774 | 0.755 | 0.798 | 0.828 | 0.819 | 0.796 | 0.803 | 0.779 | 0.760 | 0.769 | 0.741 |
| 1992 | 0.674 | 0.679 | 0.688 | 0.735 | 0.806 | 0.817 | 0.782 | 0.756 | 0.768 | 0.746 | 0.737 | 0.702 |
| 1993 | 0.698 | 0.687 | 0.683 | 0.706 | 0.763 | 0.758 | 0.733 | 0.720 | 0.705 | 0.692 | 0.677 | 0.629 |
| 1994 | 0.604 | 0.629 | 0.638 | 0.657 | 0.686 | 0.700 | 0.717 | 0.744 | 0.704 | 0.676 | 0.691 | 0.678 |
| 1995 | 0.673 | 0.685 | 0.688 | 0.738 | 0.813 | 0.815 | 0.778 | 0.728 | 0.707 | 0.671 | 0.642 | 0.686 |
| 1996 | 0.708 | 0.710 | 0.761 | 0.832 | 0.869 | 0.836 | 0.816 | 0.802 | 0.804 | 0.809 | 0.849 | 0.843 |
| 1997 | 0.832 | 0.819 | 0.818 | 0.824 | 0.834 | 0.818 | 0.783 | 0.816 | 0.800 | 0.767 | 0.742 | 0.706 |
| 1998 | 0.656 | 0.629 | 0.619 | 0.654 | 0.685 | 0.675 | 0.645 | 0.598 | 0.582 | 0.600 | 0.569 | 0.509 |
| 1999 | 0.515 | 0.488 | 0.603 | 0.692 | 0.697 | 0.698 | 0.752 | 0.805 | 0.854 | 0.824 | 0.862 | 0.889 |
| 2000 | 0.919 | 1.019 | 1.077 | 0.996 | 1.082 | 1.221 | 1.108 | 0.996 | 1.128 | 1.104 | 1.094 | 0.992 |
| 2001 | 1.051 | 1.031 | 0.976 | 1.160 | 1.293 | 1.117 | 0.882 | 1.017 | 1.088 | 0.803 | 0.732 | 0.680 |
| 2002 | 0.718 | 0.693 | 0.854 | 0.959 | 0.949 | 0.947 | 0.963 | 0.950 | 0.974 | 1.043 | 0.957 | 0.968 |
| 2003 | 1.067 | 1.218 | 1.231 | 1.078 | 1.010 | 1.024 | 1.052 | 1.177 | 1.126 | 1.070 | 1.051 | 1.027 |
| 2004 | 1.156 | 1.224 | 1.278 | 1.356 | 1.519 | 1.440 | 1.426 | 1.413 | 1.439 | 1.575 | 1.506 | 1.329 |
| 2005 | 1.394 | 1.460 | 1.672 | 1.789 | 1.629 | 1.709 | 1.810 | 2.082 | 2.415 | 2.225 | 1.720 | 1.770 |
| 2006 | 1.883 | 1.793 | 2.031 | 2.380 | 2.361 | 2.366 | 2.513 | 2.393 | 1.898 | 1.727 | 1.775 | 1.835 |
| 2007 | 1.699 | 1.819 | 2.062 | 2.367 | 2.670 | 2.560 | 2.487 | 2.312 | 2.386 | 2.332 | 2.574 | 2.500 |
| 2008 | 2.557 | 2.585 | 2.792 | 3.002 | 3.361 | 3.547 | 3.544 | 3.247 | 3.318 | 2.482 | 1.474 | 1.190 |
| 2009 | 1.397 | 1.429 | 1.483 | 1.570 | 1.889 | 2.188 | 2.039 | 2.112 | 2.001 | 2.067 | 2.130 | 2.077 |
| 2010 | 2.170 | 2.125 | 2.288 | 2.384 | 2.329 | 2.230 | 2.226 | 2.219 | 2.253 | 2.320 | 2.374 | 2.506 |
| 2011 | 2.621 | 2.699 | - | - | - | - | - | - | - | - | - | - |
| 2012 | - | - | - | - | - | - | - | - | - | - | - | - |
| 2013 | - | - | - | - | - | - | - | - | - | - | - | - |
| 2014 | - | - | - | - | - | - | - | - | - | - | - | - |
| 2015 | - | - | - | - | - | - | - | - | - | - | - | - |
| 2016 | - | - | - | - | - | - | - | - | - | - | - | - |
| 2017 | - | - | - | - | - | - | - | - | - | - | - | - |
| 2018 | - | - | - | - | - | - | - | - | - | - | - | - |
| 2019 | - | - | - | - | - | - | - | - | - | - | - | - |
| 2020 | - | - | - | - | - | - | - | - | - | - | - | - |
| 2021 | - | - | - | - | - | - | - | - | - | - | - | - |
| 2022 | - | - | - | |||||||||
| - = No Data Reported; -- = Not Applicable; NA = Not Available; W = Withheld to avoid disclosure of individual company data. |
| Release Date: 6/1/2022 |
| Next Release Date: TBD |