|
Download Data (XLS File) |
|
||||||||
|
||||||||
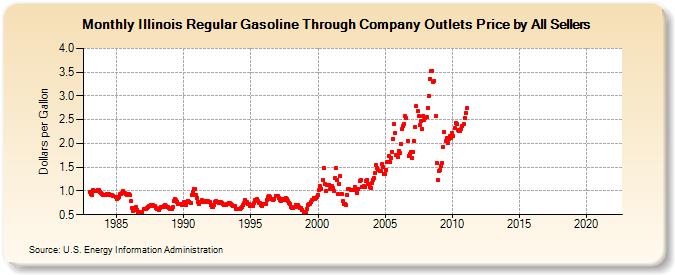
| Illinois Regular Gasoline Through Company Outlets Price by All Sellers (Dollars per Gallon) | ||||||||
| Year | Jan | Feb | Mar | Apr | May | Jun | Jul | Aug | Sep | Oct | Nov | Dec |
|---|---|---|---|---|---|---|---|---|---|---|---|---|
| 1983 | 0.988 | 0.945 | 0.916 | 1.022 | 1.003 | 1.008 | 1.005 | 1.025 | 1.013 | 0.981 | 0.959 | 0.935 |
| 1984 | 0.916 | 0.908 | 0.911 | 0.936 | 0.941 | 0.930 | 0.908 | NA | 0.908 | 0.901 | NA | 0.865 |
| 1985 | 0.835 | 0.843 | 0.874 | 0.927 | 0.943 | 0.960 | 0.993 | 0.951 | 0.929 | 0.920 | 0.937 | 0.933 |
| 1986 | 0.905 | 0.786 | 0.635 | 0.575 | 0.635 | 0.662 | 0.594 | 0.554 | 0.550 | 0.533 | 0.533 | 0.553 |
| 1987 | 0.611 | 0.618 | 0.628 | 0.651 | 0.663 | 0.678 | 0.693 | 0.714 | 0.704 | 0.688 | 0.680 | 0.651 |
| 1988 | 0.629 | 0.624 | 0.608 | 0.642 | 0.662 | 0.658 | 0.684 | 0.712 | 0.684 | 0.668 | 0.663 | 0.639 |
| 1989 | 0.623 | 0.627 | 0.655 | 0.799 | 0.822 | 0.805 | 0.777 | 0.727 | 0.726 | 0.727 | 0.702 | 0.694 |
| 1990 | 0.762 | 0.731 | 0.695 | 0.762 | 0.785 | 0.778 | 0.750 | 0.919 | 0.987 | 1.047 | 1.032 | 0.925 |
| 1991 | 0.859 | 0.771 | 0.732 | 0.769 | 0.808 | 0.792 | 0.761 | 0.794 | 0.769 | 0.758 | 0.782 | 0.758 |
| 1992 | 0.699 | 0.672 | 0.665 | 0.714 | 0.771 | 0.796 | 0.774 | 0.752 | 0.766 | 0.762 | 0.749 | 0.720 |
| 1993 | 0.707 | 0.694 | 0.708 | 0.735 | 0.752 | 0.738 | 0.716 | 0.702 | 0.686 | 0.689 | 0.676 | 0.620 |
| 1994 | 0.616 | 0.626 | 0.611 | 0.644 | 0.656 | 0.700 | 0.736 | 0.800 | 0.775 | 0.735 | 0.720 | 0.685 |
| 1995 | 0.692 | 0.694 | 0.686 | 0.743 | 0.814 | 0.827 | 0.783 | 0.748 | 0.736 | 0.710 | 0.692 | 0.716 |
| 1996 | 0.732 | 0.735 | 0.810 | 0.876 | 0.890 | 0.865 | 0.841 | 0.825 | 0.817 | 0.830 | 0.890 | 0.894 |
| 1997 | 0.887 | 0.853 | 0.814 | 0.799 | 0.823 | 0.822 | 0.810 | 0.857 | 0.828 | 0.783 | 0.757 | 0.721 |
| 1998 | 0.665 | 0.648 | 0.635 | 0.664 | 0.710 | 0.695 | 0.697 | 0.662 | 0.646 | 0.646 | 0.606 | 0.546 |
| 1999 | 0.559 | 0.531 | 0.626 | 0.709 | 0.727 | 0.719 | 0.766 | 0.815 | 0.856 | 0.832 | 0.861 | 0.868 |
| 2000 | 0.915 | 1.014 | 1.098 | 1.042 | 1.223 | 1.487 | 1.154 | 1.007 | 1.131 | 1.126 | 1.133 | 1.050 |
| 2001 | 1.100 | 1.065 | 0.995 | 1.264 | 1.475 | 1.239 | 0.945 | 1.148 | 1.307 | 0.945 | 0.780 | 0.730 |
| 2002 | 0.717 | 0.710 | 0.918 | 1.040 | 1.032 | 1.027 | 1.017 | 1.022 | 1.021 | 1.087 | 1.029 | 0.957 |
| 2003 | 1.049 | 1.212 | 1.236 | 1.093 | 1.074 | 1.103 | 1.088 | 1.204 | 1.226 | 1.144 | 1.088 | 1.059 |
| 2004 | 1.165 | 1.230 | 1.278 | 1.383 | 1.552 | 1.484 | 1.434 | 1.427 | 1.410 | 1.559 | 1.499 | 1.351 |
| 2005 | 1.367 | 1.442 | 1.617 | 1.743 | 1.619 | 1.693 | 1.822 | 2.100 | 2.402 | 2.223 | 1.758 | 1.725 |
| 2006 | 1.838 | 1.793 | 1.992 | 2.302 | 2.377 | 2.409 | 2.567 | 2.528 | 2.054 | 1.736 | 1.776 | 1.820 |
| 2007 | 1.696 | 1.819 | 2.042 | 2.342 | 2.780 | 2.675 | 2.582 | 2.387 | 2.465 | 2.314 | 2.572 | 2.489 |
| 2008 | 2.541 | 2.548 | 2.754 | 2.995 | 3.351 | 3.521 | 3.530 | 3.283 | 3.320 | 2.571 | 1.584 | 1.231 |
| 2009 | 1.421 | 1.445 | 1.522 | 1.591 | 1.920 | 2.234 | 2.049 | 2.116 | 2.000 | 2.091 | 2.149 | 2.114 |
| 2010 | 2.226 | 2.148 | 2.319 | 2.434 | 2.406 | 2.277 | 2.262 | 2.264 | 2.303 | 2.358 | 2.399 | 2.538 |
| 2011 | 2.639 | 2.742 | - | - | - | - | - | - | - | - | - | - |
| 2012 | - | - | - | - | - | - | - | - | - | - | - | - |
| 2013 | - | - | - | - | - | - | - | - | - | - | - | - |
| 2014 | - | - | - | - | - | - | - | - | - | - | - | - |
| 2015 | - | - | - | - | - | - | - | - | - | - | - | - |
| 2016 | - | - | - | - | - | - | - | - | - | - | - | - |
| 2017 | - | - | - | - | - | - | - | - | - | - | - | - |
| 2018 | - | - | - | - | - | - | - | - | - | - | - | - |
| 2019 | - | - | - | - | - | - | - | - | - | - | - | - |
| 2020 | - | - | - | - | - | - | - | - | - | - | - | - |
| 2021 | - | - | - | - | - | - | - | - | - | - | - | - |
| 2022 | - | - | - | |||||||||
| - = No Data Reported; -- = Not Applicable; NA = Not Available; W = Withheld to avoid disclosure of individual company data. |
| Release Date: 6/1/2022 |
| Next Release Date: TBD |