|
Download Data (XLS File) |
|
||||||||
|
||||||||
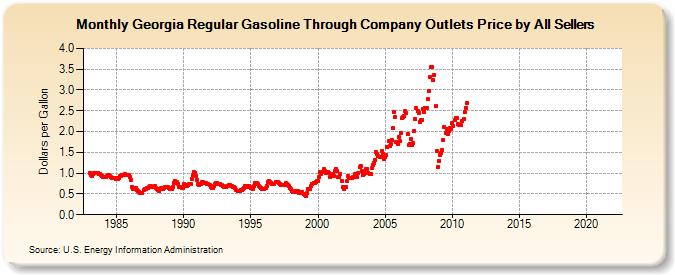
| Georgia Regular Gasoline Through Company Outlets Price by All Sellers (Dollars per Gallon) | ||||||||
| Year | Jan | Feb | Mar | Apr | May | Jun | Jul | Aug | Sep | Oct | Nov | Dec |
|---|---|---|---|---|---|---|---|---|---|---|---|---|
| 1983 | 1.000 | 0.965 | 0.937 | 0.968 | 0.997 | 0.999 | 1.002 | 0.995 | 0.989 | 0.979 | 0.962 | 0.938 |
| 1984 | 0.906 | 0.908 | 0.911 | 0.923 | 0.961 | 0.954 | 0.923 | 0.912 | 0.886 | 0.888 | 0.877 | 0.849 |
| 1985 | 0.873 | 0.858 | 0.892 | 0.941 | 0.943 | 0.946 | 0.966 | 0.973 | 0.961 | 0.947 | 0.950 | 0.951 |
| 1986 | 0.905 | 0.837 | 0.677 | 0.613 | 0.631 | 0.640 | 0.594 | 0.564 | 0.556 | 0.525 | 0.526 | 0.533 |
| 1987 | 0.593 | 0.614 | 0.623 | 0.642 | 0.648 | 0.671 | 0.680 | 0.684 | 0.672 | 0.664 | 0.681 | 0.644 |
| 1988 | 0.617 | 0.599 | 0.576 | 0.630 | 0.633 | 0.624 | 0.644 | 0.655 | 0.662 | 0.664 | 0.666 | 0.643 |
| 1989 | 0.621 | 0.612 | 0.662 | 0.774 | 0.807 | 0.791 | 0.778 | 0.735 | 0.674 | 0.668 | 0.649 | 0.642 |
| 1990 | 0.727 | 0.712 | 0.689 | 0.699 | 0.726 | 0.739 | 0.733 | 0.867 | 0.964 | 1.029 | 1.008 | 0.933 |
| 1991 | 0.838 | 0.745 | 0.712 | 0.740 | 0.785 | 0.790 | 0.762 | 0.772 | 0.768 | 0.737 | 0.734 | 0.711 |
| 1992 | 0.676 | 0.653 | 0.647 | 0.680 | 0.727 | 0.756 | 0.754 | 0.739 | 0.731 | 0.715 | 0.705 | 0.681 |
| 1993 | 0.665 | 0.655 | 0.661 | 0.684 | 0.707 | 0.711 | 0.697 | 0.681 | 0.664 | 0.663 | 0.639 | 0.593 |
| 1994 | 0.562 | 0.576 | 0.573 | 0.589 | 0.599 | 0.624 | 0.649 | 0.695 | 0.690 | 0.675 | 0.679 | 0.661 |
| 1995 | 0.642 | 0.631 | 0.627 | 0.684 | 0.754 | 0.765 | 0.729 | 0.686 | 0.661 | 0.646 | 0.617 | 0.609 |
| 1996 | 0.627 | 0.633 | 0.686 | 0.775 | 0.809 | 0.787 | 0.764 | 0.742 | 0.734 | 0.739 | 0.777 | 0.779 |
| 1997 | 0.779 | 0.761 | 0.728 | 0.713 | 0.703 | 0.706 | 0.703 | 0.751 | 0.745 | 0.711 | 0.682 | 0.646 |
| 1998 | 0.607 | 0.571 | 0.555 | 0.558 | 0.566 | 0.576 | 0.559 | 0.533 | 0.526 | 0.555 | 0.535 | 0.493 |
| 1999 | 0.475 | 0.452 | 0.511 | 0.624 | 0.624 | 0.622 | 0.681 | 0.735 | 0.762 | 0.757 | 0.778 | 0.800 |
| 2000 | 0.814 | 0.904 | 1.030 | 0.987 | 1.019 | 1.092 | 1.063 | 0.997 | 1.029 | 1.018 | 0.994 | 0.916 |
| 2001 | 0.955 | 0.974 | 0.927 | 1.046 | 1.108 | 1.054 | 0.905 | 0.904 | 0.972 | 0.820 | 0.661 | 0.611 |
| 2002 | 0.659 | 0.659 | 0.805 | 0.931 | 0.894 | 0.878 | 0.893 | 0.900 | 0.901 | 0.971 | 0.932 | 0.898 |
| 2003 | 1.002 | 1.141 | 1.182 | 1.055 | 0.967 | 0.982 | 1.028 | 1.109 | 1.102 | 1.010 | 0.988 | 0.986 |
| 2004 | 1.122 | 1.192 | 1.249 | 1.327 | 1.502 | 1.455 | 1.407 | 1.380 | 1.378 | 1.523 | 1.460 | 1.331 |
| 2005 | 1.376 | 1.432 | 1.622 | 1.772 | 1.647 | 1.694 | 1.797 | 2.074 | 2.470 | 2.352 | 1.759 | 1.698 |
| 2006 | 1.873 | 1.771 | 1.969 | 2.320 | 2.350 | 2.383 | 2.501 | 2.441 | 1.942 | 1.670 | 1.709 | 1.810 |
| 2007 | 1.682 | 1.717 | 2.023 | 2.297 | 2.563 | 2.483 | 2.457 | 2.235 | 2.269 | 2.286 | 2.551 | 2.480 |
| 2008 | 2.562 | 2.563 | 2.778 | 2.970 | 3.321 | 3.541 | 3.558 | 3.234 | 3.362 | 2.606 | 1.538 | 1.157 |
| 2009 | 1.303 | 1.426 | 1.473 | 1.545 | 1.803 | 2.115 | 1.970 | 2.057 | 1.938 | 2.013 | 2.091 | 2.071 |
| 2010 | 2.204 | 2.126 | 2.270 | 2.330 | 2.331 | 2.171 | 2.163 | 2.159 | 2.149 | 2.243 | 2.304 | 2.469 |
| 2011 | 2.578 | 2.682 | - | - | - | - | - | - | - | - | - | - |
| 2012 | - | - | - | - | - | - | - | - | - | - | - | - |
| 2013 | - | - | - | - | - | - | - | - | - | - | - | - |
| 2014 | - | - | - | - | - | - | - | - | - | - | - | - |
| 2015 | - | - | - | - | - | - | - | - | - | - | - | - |
| 2016 | - | - | - | - | - | - | - | - | - | - | - | - |
| 2017 | - | - | - | - | - | - | - | - | - | - | - | - |
| 2018 | - | - | - | - | - | - | - | - | - | - | - | - |
| 2019 | - | - | - | - | - | - | - | - | - | - | - | - |
| 2020 | - | - | - | - | - | - | - | - | - | - | - | - |
| 2021 | - | - | - | - | - | - | - | - | - | - | - | - |
| 2022 | - | - | - | |||||||||
| - = No Data Reported; -- = Not Applicable; NA = Not Available; W = Withheld to avoid disclosure of individual company data. |
| Release Date: 6/1/2022 |
| Next Release Date: TBD |