|
Download Data (XLS File) |
|
||||||||
|
||||||||
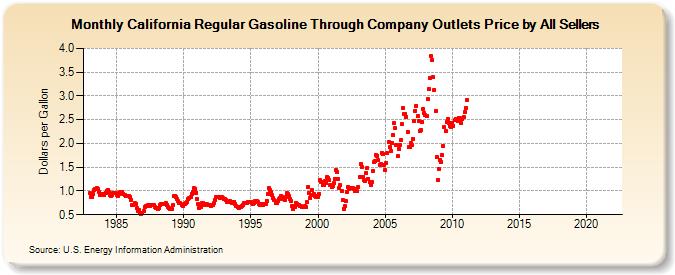
| California Regular Gasoline Through Company Outlets Price by All Sellers (Dollars per Gallon) | ||||||||
| Year | Jan | Feb | Mar | Apr | May | Jun | Jul | Aug | Sep | Oct | Nov | Dec |
|---|---|---|---|---|---|---|---|---|---|---|---|---|
| 1983 | 0.955 | 0.880 | 0.877 | 0.941 | 1.012 | 1.041 | 1.061 | 1.037 | 0.986 | 0.917 | 0.929 | 0.945 |
| 1984 | 0.944 | 0.925 | 0.967 | 1.006 | 1.014 | 0.973 | 0.919 | 0.899 | 0.923 | 0.963 | 0.967 | 0.948 |
| 1985 | 0.912 | 0.895 | 0.938 | 0.972 | 0.984 | 0.977 | 0.942 | 0.908 | 0.901 | 0.885 | 0.884 | 0.894 |
| 1986 | 0.877 | 0.811 | 0.712 | 0.705 | 0.744 | 0.729 | 0.632 | 0.588 | 0.596 | 0.542 | 0.518 | 0.529 |
| 1987 | 0.576 | 0.657 | 0.675 | 0.688 | 0.702 | 0.699 | 0.688 | 0.704 | 0.698 | 0.698 | 0.669 | 0.648 |
| 1988 | 0.647 | 0.630 | 0.636 | 0.699 | 0.721 | 0.730 | 0.731 | 0.734 | 0.742 | 0.711 | 0.667 | 0.639 |
| 1989 | 0.615 | 0.629 | 0.704 | 0.892 | 0.894 | 0.873 | 0.837 | 0.782 | 0.749 | 0.740 | 0.707 | 0.693 |
| 1990 | 0.718 | 0.727 | 0.752 | 0.778 | 0.825 | 0.848 | 0.872 | 0.940 | 0.982 | 1.056 | 1.047 | 0.962 |
| 1991 | 0.838 | 0.729 | 0.632 | 0.661 | 0.741 | 0.743 | 0.701 | 0.719 | 0.734 | 0.719 | 0.708 | 0.694 |
| 1992 | 0.693 | 0.701 | 0.701 | 0.742 | 0.819 | 0.864 | 0.880 | 0.871 | 0.858 | 0.864 | 0.877 | 0.854 |
| 1993 | 0.838 | 0.828 | 0.801 | 0.773 | 0.775 | 0.784 | 0.771 | 0.753 | 0.749 | 0.771 | 0.723 | 0.675 |
| 1994 | 0.659 | 0.649 | 0.656 | 0.672 | 0.688 | 0.710 | 0.736 | 0.754 | 0.757 | 0.772 | 0.777 | 0.761 |
| 1995 | 0.770 | 0.744 | 0.735 | 0.747 | 0.784 | 0.785 | 0.759 | 0.729 | 0.705 | 0.724 | 0.723 | 0.709 |
| 1996 | 0.715 | 0.728 | 0.786 | 0.940 | 1.058 | 1.022 | 0.979 | 0.910 | 0.849 | 0.806 | 0.739 | 0.738 |
| 1997 | 0.792 | 0.834 | 0.853 | 0.898 | 0.880 | 0.832 | 0.805 | 0.870 | 0.954 | 0.940 | 0.889 | 0.840 |
| 1998 | 0.785 | 0.687 | 0.622 | 0.662 | 0.748 | 0.726 | 0.703 | 0.700 | 0.684 | 0.677 | 0.672 | 0.670 |
| 1999 | 0.673 | 0.660 | 0.768 | 1.079 | 0.964 | 0.848 | 0.910 | 1.013 | 0.942 | 0.892 | 0.878 | 0.894 |
| 2000 | 0.879 | 0.944 | 1.221 | 1.197 | 1.118 | 1.128 | 1.201 | 1.167 | 1.290 | 1.275 | 1.234 | 1.134 |
| 2001 | 1.076 | 1.114 | 1.167 | 1.258 | 1.431 | 1.403 | 1.254 | 1.067 | 1.118 | 0.991 | 0.809 | 0.628 |
| 2002 | 0.682 | 0.783 | 0.970 | 1.084 | 1.044 | 1.063 | 1.063 | 1.055 | 1.037 | 0.995 | 1.044 | 0.991 |
| 2003 | 1.091 | 1.290 | 1.563 | 1.505 | 1.300 | 1.234 | 1.213 | 1.383 | 1.483 | 1.261 | 1.182 | 1.133 |
| 2004 | 1.193 | 1.427 | 1.602 | 1.631 | 1.752 | 1.745 | 1.643 | 1.556 | 1.569 | 1.806 | 1.778 | 1.538 |
| 2005 | 1.442 | 1.593 | 1.793 | 2.032 | 1.918 | 1.837 | 2.004 | 2.184 | 2.431 | 2.318 | 1.976 | 1.731 |
| 2006 | 1.888 | 1.969 | 2.062 | 2.403 | 2.743 | 2.624 | 2.625 | 2.566 | 2.241 | 1.930 | 1.920 | 2.015 |
| 2007 | 1.965 | 2.089 | 2.476 | 2.690 | 2.797 | 2.574 | 2.477 | 2.269 | 2.287 | 2.453 | 2.720 | 2.636 |
| 2008 | 2.593 | 2.568 | 2.928 | 3.145 | 3.380 | 3.841 | 3.759 | 3.394 | 3.128 | 2.687 | 1.724 | 1.238 |
| 2009 | 1.458 | 1.660 | 1.612 | 1.753 | 1.942 | 2.344 | 2.257 | 2.442 | 2.520 | 2.435 | 2.364 | 2.340 |
| 2010 | 2.432 | 2.369 | 2.485 | 2.510 | 2.496 | 2.481 | 2.531 | 2.537 | 2.424 | 2.509 | 2.560 | 2.664 |
| 2011 | 2.746 | 2.911 | - | - | - | - | - | - | - | - | - | - |
| 2012 | - | - | - | - | - | - | - | - | - | - | - | - |
| 2013 | - | - | - | - | - | - | - | - | - | - | - | - |
| 2014 | - | - | - | - | - | - | - | - | - | - | - | - |
| 2015 | - | - | - | - | - | - | - | - | - | - | - | - |
| 2016 | - | - | - | - | - | - | - | - | - | - | - | - |
| 2017 | - | - | - | - | - | - | - | - | - | - | - | - |
| 2018 | - | - | - | - | - | - | - | - | - | - | - | - |
| 2019 | - | - | - | - | - | - | - | - | - | - | - | - |
| 2020 | - | - | - | - | - | - | - | - | - | - | - | - |
| 2021 | - | - | - | - | - | - | - | - | - | - | - | - |
| 2022 | - | - | - | |||||||||
| - = No Data Reported; -- = Not Applicable; NA = Not Available; W = Withheld to avoid disclosure of individual company data. |
| Release Date: 6/1/2022 |
| Next Release Date: TBD |