|
Download Data (XLS File) |
|
||||||||
|
||||||||
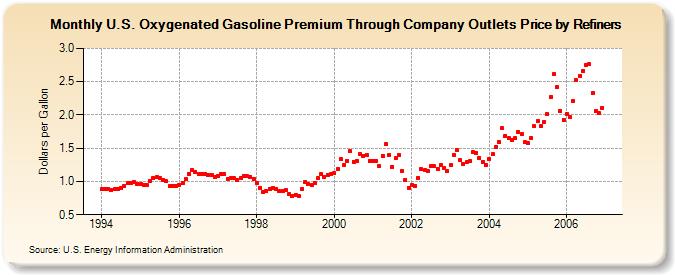
| U.S. Oxygenated Gasoline Premium Through Company Outlets Price by Refiners (Dollars per Gallon) | ||||||||
| Year | Jan | Feb | Mar | Apr | May | Jun | Jul | Aug | Sep | Oct | Nov | Dec |
|---|---|---|---|---|---|---|---|---|---|---|---|---|
| 1994 | 0.884 | 0.880 | 0.891 | 0.874 | 0.879 | 0.888 | 0.909 | 0.939 | 0.971 | 0.973 | 0.992 | 0.968 |
| 1995 | 0.959 | 0.950 | 0.940 | 1.007 | 1.054 | 1.064 | 1.049 | 1.022 | 1.001 | 0.925 | 0.926 | 0.933 |
| 1996 | 0.954 | 0.971 | 1.030 | 1.114 | 1.172 | 1.145 | 1.119 | 1.118 | 1.119 | 1.101 | 1.101 | 1.071 |
| 1997 | 1.085 | 1.109 | 1.110 | 1.042 | 1.055 | 1.047 | 1.018 | 1.051 | 1.085 | 1.077 | 1.073 | 1.041 |
| 1998 | 0.983 | 0.905 | 0.846 | 0.851 | 0.891 | 0.907 | 0.891 | 0.849 | 0.853 | 0.875 | 0.814 | 0.782 |
| 1999 | 0.801 | 0.776 | 0.885 | 0.988 | 0.963 | 0.946 | 0.970 | 1.051 | 1.105 | 1.074 | 1.101 | 1.113 |
| 2000 | 1.120 | 1.184 | 1.331 | 1.250 | 1.309 | 1.457 | 1.298 | 1.314 | 1.409 | 1.390 | 1.393 | 1.307 |
| 2001 | 1.302 | 1.308 | 1.229 | 1.387 | 1.559 | 1.395 | 1.223 | 1.346 | 1.393 | 1.162 | 1.024 | 0.909 |
| 2002 | 0.945 | 0.936 | 1.057 | 1.182 | 1.166 | 1.160 | 1.228 | 1.227 | 1.191 | 1.241 | 1.203 | 1.157 |
| 2003 | 1.244 | 1.405 | 1.476 | 1.315 | 1.269 | 1.292 | 1.302 | 1.442 | 1.427 | 1.354 | 1.298 | 1.244 |
| 2004 | 1.344 | 1.408 | 1.518 | 1.594 | 1.796 | 1.687 | 1.653 | 1.628 | 1.647 | 1.750 | 1.712 | 1.587 |
| 2005 | 1.572 | 1.650 | 1.826 | 1.908 | 1.832 | 1.894 | 2.013 | 2.266 | 2.612 | 2.419 | 2.056 | 1.924 |
| 2006 | 2.016 | 1.968 | 2.207 | 2.521 | 2.592 | 2.659 | 2.756 | 2.761 | 2.329 | 2.056 | 2.026 | 2.111 |
| - = No Data Reported; -- = Not Applicable; NA = Not Available; W = Withheld to avoid disclosure of individual company data. |
| Release Date: 6/1/2022 |
| Next Release Date: TBD |