|
Download Data (XLS File) |
|
||||||||
|
||||||||
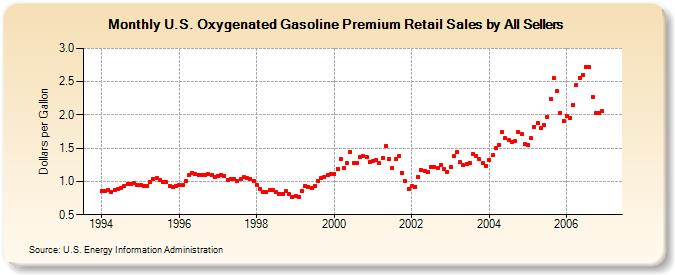
| U.S. Oxygenated Gasoline Premium Retail Sales by All Sellers (Dollars per Gallon) | ||||||||
| Year | Jan | Feb | Mar | Apr | May | Jun | Jul | Aug | Sep | Oct | Nov | Dec |
|---|---|---|---|---|---|---|---|---|---|---|---|---|
| 1994 | 0.860 | 0.854 | 0.865 | 0.844 | 0.873 | 0.884 | 0.909 | 0.938 | 0.964 | 0.959 | 0.971 | 0.950 |
| 1995 | 0.942 | 0.935 | 0.938 | 0.990 | 1.033 | 1.051 | 1.022 | 0.990 | 0.991 | 0.935 | 0.922 | 0.928 |
| 1996 | 0.942 | 0.954 | 1.005 | 1.093 | 1.134 | 1.110 | 1.103 | 1.095 | 1.102 | 1.106 | 1.092 | 1.065 |
| 1997 | 1.086 | 1.103 | 1.088 | 1.021 | 1.039 | 1.033 | 1.006 | 1.041 | 1.063 | 1.051 | 1.044 | 1.008 |
| 1998 | 0.950 | 0.887 | 0.846 | 0.839 | 0.869 | 0.873 | 0.847 | 0.818 | 0.817 | 0.854 | 0.805 | 0.767 |
| 1999 | 0.781 | 0.770 | 0.859 | 0.931 | 0.918 | 0.904 | 0.934 | 1.004 | 1.056 | 1.070 | 1.095 | 1.107 |
| 2000 | 1.119 | 1.188 | 1.338 | 1.203 | 1.272 | 1.447 | 1.271 | 1.283 | 1.372 | 1.384 | 1.363 | 1.292 |
| 2001 | 1.311 | 1.316 | 1.274 | 1.358 | 1.535 | 1.344 | 1.202 | 1.331 | 1.385 | 1.134 | 1.001 | 0.893 |
| 2002 | 0.930 | 0.923 | 1.072 | 1.173 | 1.163 | 1.145 | 1.211 | 1.222 | 1.195 | 1.249 | 1.187 | 1.145 |
| 2003 | 1.222 | 1.376 | 1.445 | 1.286 | 1.245 | 1.264 | 1.282 | 1.416 | 1.389 | 1.333 | 1.281 | 1.239 |
| 2004 | 1.327 | 1.393 | 1.497 | 1.552 | 1.750 | 1.646 | 1.619 | 1.595 | 1.605 | 1.745 | 1.712 | 1.556 |
| 2005 | 1.545 | 1.648 | 1.819 | 1.884 | 1.799 | 1.855 | 1.975 | 2.236 | 2.554 | 2.361 | 2.030 | 1.905 |
| 2006 | 1.991 | 1.954 | 2.150 | 2.456 | 2.550 | 2.606 | 2.721 | 2.721 | 2.276 | 2.024 | 2.036 | 2.058 |
| - = No Data Reported; -- = Not Applicable; NA = Not Available; W = Withheld to avoid disclosure of individual company data. |
| Release Date: 6/1/2022 |
| Next Release Date: TBD |