|
Download Data (XLS File) |
|
||||||||
|
||||||||
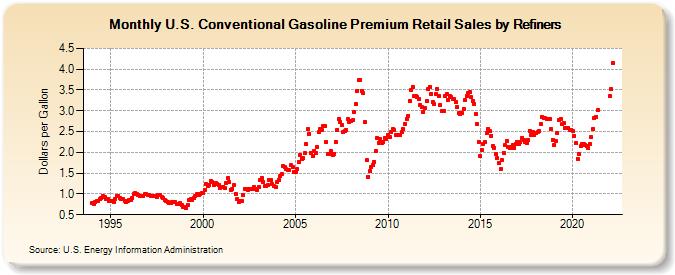
| U.S. Conventional Gasoline Premium Retail Sales by Refiners (Dollars per Gallon) | ||||||||
| Year | Jan | Feb | Mar | Apr | May | Jun | Jul | Aug | Sep | Oct | Nov | Dec |
|---|---|---|---|---|---|---|---|---|---|---|---|---|
| 1994 | 0.773 | 0.767 | 0.796 | 0.823 | 0.841 | 0.868 | 0.897 | 0.943 | 0.924 | 0.883 | 0.876 | 0.834 |
| 1995 | 0.830 | 0.827 | 0.810 | 0.885 | 0.955 | 0.953 | 0.910 | 0.882 | 0.874 | 0.838 | 0.807 | 0.826 |
| 1996 | 0.846 | 0.849 | 0.911 | 0.992 | 1.024 | 0.993 | 0.972 | 0.953 | 0.959 | 0.958 | 0.992 | 0.989 |
| 1997 | 0.986 | 0.974 | 0.955 | 0.955 | 0.956 | 0.946 | 0.931 | 0.983 | 0.975 | 0.936 | 0.904 | 0.864 |
| 1998 | 0.821 | 0.796 | 0.772 | 0.790 | 0.814 | 0.811 | 0.801 | 0.769 | 0.756 | 0.773 | 0.738 | 0.689 |
| 1999 | 0.685 | 0.669 | 0.737 | 0.855 | 0.866 | 0.854 | 0.901 | 0.953 | 0.991 | 0.985 | 0.987 | 1.014 |
| 2000 | 1.029 | 1.102 | 1.233 | 1.183 | 1.210 | 1.315 | 1.284 | 1.207 | 1.263 | 1.241 | 1.213 | 1.145 |
| 2001 | 1.170 | 1.172 | 1.134 | 1.271 | 1.375 | 1.278 | 1.106 | 1.127 | 1.208 | 1.007 | 0.874 | 0.811 |
| 2002 | 0.827 | 0.825 | 0.975 | 1.121 | 1.114 | 1.101 | 1.116 | 1.112 | 1.115 | 1.170 | 1.128 | 1.098 |
| 2003 | 1.174 | 1.336 | 1.384 | 1.282 | 1.180 | 1.190 | 1.213 | 1.323 | 1.335 | 1.228 | 1.183 | 1.162 |
| 2004 | 1.284 | 1.342 | 1.420 | 1.485 | 1.661 | 1.643 | 1.593 | 1.573 | 1.567 | 1.687 | 1.659 | 1.537 |
| 2005 | 1.539 | 1.598 | 1.765 | 1.936 | 1.847 | 1.853 | 1.973 | 2.200 | 2.556 | 2.443 | 1.991 | 1.906 |
| 2006 | 2.033 | 1.981 | 2.134 | 2.478 | 2.556 | 2.532 | 2.633 | 2.633 | 2.249 | 1.968 | 1.953 | 2.026 |
| 2007 | 1.945 | 1.970 | 2.258 | 2.547 | 2.812 | 2.732 | 2.653 | 2.494 | 2.525 | 2.533 | 2.794 | 2.728 |
| 2008 | 2.752 | 2.766 | 2.969 | 3.156 | 3.482 | 3.733 | 3.743 | 3.477 | 3.418 | 2.729 | 1.807 | 1.419 |
| 2009 | 1.541 | 1.654 | 1.691 | 1.779 | 2.029 | 2.352 | 2.229 | 2.313 | 2.223 | 2.256 | 2.355 | 2.327 |
| 2010 | 2.413 | 2.360 | 2.489 | 2.561 | 2.530 | 2.419 | 2.415 | 2.424 | 2.408 | 2.495 | 2.555 | 2.687 |
| 2011 | 2.799 | 2.885 | 3.246 | 3.505 | 3.578 | 3.351 | 3.352 | 3.326 | 3.271 | 3.141 | 3.081 | 2.977 |
| 2012 | 3.075 | 3.236 | 3.517 | 3.571 | 3.411 | 3.201 | 3.151 | 3.402 | 3.527 | 3.360 | 3.135 | 2.983 |
| 2013 | 2.999 | 3.360 | 3.397 | 3.269 | 3.354 | 3.327 | 3.291 | 3.274 | 3.203 | 3.087 | 2.943 | 2.912 |
| 2014 | 2.948 | 3.051 | 3.249 | 3.344 | 3.416 | 3.446 | 3.329 | 3.242 | 3.170 | 2.927 | 2.671 | 2.258 |
| 2015 | 1.901 | 2.054 | 2.207 | 2.239 | 2.454 | 2.570 | 2.504 | 2.401 | 2.158 | 2.114 | 1.970 | 1.860 |
| 2016 | 1.733 | 1.590 | 1.808 | 1.992 | 2.170 | 2.270 | 2.119 | 2.099 | 2.137 | 2.178 | 2.108 | 2.204 |
| 2017 | 2.258 | 2.210 | 2.247 | 2.352 | 2.306 | 2.257 | 2.220 | 2.302 | 2.514 | 2.412 | 2.489 | 2.417 |
| 2018 | 2.468 | 2.482 | 2.502 | 2.676 | 2.852 | 2.832 | 2.814 | 2.798 | 2.796 | 2.806 | 2.565 | 2.306 |
| 2019 | 2.179 | 2.266 | 2.472 | 2.768 | 2.803 | 2.674 | 2.706 | 2.580 | 2.586 | 2.586 | 2.547 | 2.536 |
| 2020 | 2.504 | 2.399 | 2.216 | 1.850 | 1.960 | 2.142 | 2.207 | 2.193 | 2.183 | 2.156 | 2.101 | 2.206 |
| 2021 | 2.366 | 2.567 | 2.823 | 2.857 | 3.016 | W | W | W | W | W | W | W |
| 2022 | 3.345 | 3.512 | 4.149 | |||||||||
| - = No Data Reported; -- = Not Applicable; NA = Not Available; W = Withheld to avoid disclosure of individual company data. |
| Release Date: 6/1/2022 |
| Next Release Date: TBD |