|
Download Data (XLS File) |
|
||||||||
|
||||||||
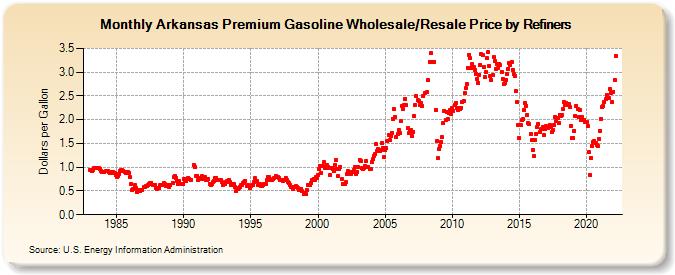
| Arkansas Premium Gasoline Wholesale/Resale Price by Refiners (Dollars per Gallon) | ||||||||
| Year | Jan | Feb | Mar | Apr | May | Jun | Jul | Aug | Sep | Oct | Nov | Dec |
|---|---|---|---|---|---|---|---|---|---|---|---|---|
| 1983 | 0.950 | 0.934 | 0.911 | 0.950 | 0.983 | 0.985 | 0.990 | 0.986 | 0.978 | 0.960 | 0.930 | 0.892 |
| 1984 | 0.889 | 0.909 | 0.912 | 0.925 | 0.925 | 0.907 | 0.885 | 0.880 | 0.895 | 0.899 | 0.874 | 0.833 |
| 1985 | 0.795 | 0.813 | 0.866 | 0.924 | 0.948 | 0.944 | 0.929 | 0.904 | 0.876 | 0.878 | 0.909 | 0.875 |
| 1986 | 0.785 | 0.650 | 0.527 | 0.548 | 0.623 | 0.572 | 0.475 | 0.513 | 0.518 | 0.501 | 0.516 | 0.518 |
| 1987 | 0.582 | 0.585 | 0.597 | 0.612 | 0.631 | 0.646 | 0.669 | 0.674 | 0.626 | 0.629 | 0.623 | 0.559 |
| 1988 | 0.539 | 0.556 | 0.561 | 0.618 | 0.629 | 0.618 | 0.670 | 0.648 | 0.599 | 0.607 | 0.631 | 0.584 |
| 1989 | 0.617 | W | 0.664 | 0.803 | 0.816 | 0.779 | 0.706 | 0.645 | 0.704 | W | 0.648 | 0.655 |
| 1990 | 0.756 | 0.723 | 0.711 | 0.748 | 0.779 | 0.757 | 0.729 | W | W | 1.045 | 0.995 | 0.808 |
| 1991 | 0.810 | 0.728 | 0.749 | 0.780 | 0.808 | 0.751 | 0.752 | 0.786 | 0.723 | 0.734 | 0.750 | 0.649 |
| 1992 | 0.622 | 0.656 | 0.678 | 0.719 | 0.763 | 0.779 | 0.721 | 0.727 | 0.738 | 0.725 | 0.678 | 0.635 |
| 1993 | 0.638 | 0.649 | 0.684 | 0.718 | 0.728 | 0.678 | 0.634 | 0.649 | 0.624 | 0.637 | 0.578 | 0.498 |
| 1994 | 0.531 | 0.560 | 0.581 | 0.618 | 0.619 | 0.658 | 0.686 | 0.712 | 0.608 | 0.621 | 0.612 | 0.569 |
| 1995 | 0.605 | 0.622 | 0.632 | 0.692 | 0.766 | 0.705 | 0.626 | 0.642 | 0.646 | 0.597 | 0.601 | 0.624 |
| 1996 | 0.637 | 0.649 | 0.721 | 0.798 | 0.784 | 0.728 | 0.738 | 0.734 | 0.748 | 0.780 | 0.814 | 0.788 |
| 1997 | 0.792 | 0.776 | 0.739 | 0.725 | 0.739 | 0.705 | 0.720 | 0.783 | 0.726 | 0.686 | 0.662 | 0.632 |
| 1998 | 0.591 | 0.579 | 0.551 | 0.582 | 0.601 | 0.590 | 0.565 | 0.525 | 0.528 | 0.548 | 0.490 | 0.435 |
| 1999 | 0.460 | 0.435 | 0.521 | 0.625 | 0.619 | 0.618 | 0.663 | 0.724 | 0.757 | 0.737 | 0.784 | 0.782 |
| 2000 | 0.829 | 0.957 | 1.020 | 0.888 | 1.019 | 1.099 | 0.980 | 0.977 | 1.048 | 1.005 | 0.986 | 0.836 |
| 2001 | 0.984 | 0.969 | 0.910 | 1.051 | 1.144 | 0.971 | 0.810 | 0.956 | 1.004 | 0.743 | 0.654 | 0.647 |
| 2002 | 0.656 | 0.678 | 0.848 | 0.913 | 0.876 | 0.858 | 0.906 | 0.909 | 0.941 | 0.996 | 0.862 | 0.900 |
| 2003 | 1.002 | 1.152 | 1.136 | 0.978 | 0.966 | 0.992 | 1.033 | 1.126 | 1.010 | 1.007 | 0.969 | 0.971 |
| 2004 | 1.114 | 1.165 | 1.242 | 1.277 | 1.478 | 1.343 | 1.382 | 1.344 | 1.355 | 1.503 | 1.412 | 1.221 |
| 2005 | 1.354 | 1.396 | 1.543 | 1.674 | 1.572 | 1.666 | 1.729 | 2.008 | 2.224 | 2.056 | 1.641 | 1.691 |
| 2006 | 1.780 | 1.719 | 1.964 | 2.292 | 2.231 | 2.315 | 2.444 | 2.302 | 1.820 | 1.714 | 1.754 | 1.778 |
| 2007 | 1.647 | 1.749 | 2.080 | 2.310 | 2.488 | 2.404 | 2.403 | 2.309 | 2.349 | 2.294 | 2.488 | NA |
| 2008 | 2.569 | 2.576 | 2.827 | NA | 3.219 | 3.399 | NA | 3.208 | 3.209 | 2.207 | 1.549 | 1.186 |
| 2009 | 1.373 | 1.440 | 1.540 | 1.627 | 1.934 | 2.189 | 1.992 | 2.156 | 2.007 | 2.143 | 2.203 | 2.122 |
| 2010 | 2.250 | 2.183 | 2.315 | 2.349 | 2.254 | 2.213 | 2.237 | 2.215 | 2.247 | 2.367 | 2.393 | 2.560 |
| 2011 | 2.660 | 2.749 | 3.094 | 3.369 | 3.288 | 3.078 | 3.172 | 3.100 | 3.040 | 2.964 | 2.861 | 2.781 |
| 2012 | 2.947 | 3.147 | 3.382 | 3.354 | 3.100 | 2.905 | 2.997 | 3.291 | 3.416 | 3.136 | 2.914 | 2.829 |
| 2013 | 2.938 | 3.311 | 3.234 | 3.076 | 3.172 | 3.097 | 3.179 | 3.147 | 3.005 | 2.866 | 2.742 | 2.777 |
| 2014 | 2.840 | 2.962 | 3.075 | 3.201 | 3.151 | 3.217 | 3.055 | 2.953 | 2.918 | 2.602 | 2.364 | 1.894 |
| 2015 | 1.610 | 1.881 | 1.985 | 2.007 | 2.210 | 2.347 | 2.295 | 2.102 | 1.928 | 1.900 | 1.707 | 1.567 |
| 2016 | 1.370 | 1.235 | 1.580 | 1.704 | 1.852 | 1.913 | 1.742 | 1.798 | 1.805 | 1.843 | 1.678 | 1.814 |
| 2017 | 1.857 | 1.838 | 1.835 | 1.890 | 1.840 | 1.731 | 1.782 | 1.880 | 2.057 | 1.970 | 2.026 | 1.929 |
| 2018 | 2.101 | 2.071 | 2.103 | 2.224 | 2.371 | 2.309 | 2.344 | 2.311 | 2.326 | 2.269 | 1.872 | 1.616 |
| 2019 | 1.617 | 1.768 | 2.072 | 2.292 | 2.228 | 2.052 | 2.195 | 1.999 | 2.046 | 2.000 | 1.999 | 1.952 |
| 2020 | 1.945 | 1.865 | 1.317 | 0.840 | 1.201 | 1.456 | 1.539 | 1.549 | 1.519 | 1.474 | 1.448 | 1.600 |
| 2021 | 1.770 | 2.017 | 2.275 | 2.288 | 2.366 | 2.425 | 2.526 | 2.454 | 2.450 | 2.647 | 2.570 | 2.375 |
| 2022 | 2.592 | 2.837 | 3.348 | |||||||||
| - = No Data Reported; -- = Not Applicable; NA = Not Available; W = Withheld to avoid disclosure of individual company data. |
| Release Date: 6/1/2022 |
| Next Release Date: TBD |