|
Download Data (XLS File) |
|
||||||||
|
||||||||
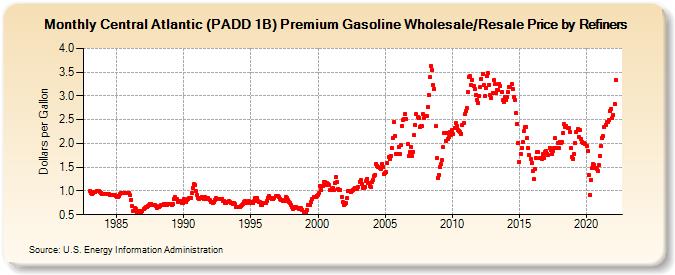
| Central Atlantic (PADD 1B) Premium Gasoline Wholesale/Resale Price by Refiners (Dollars per Gallon) | ||||||||
| Year | Jan | Feb | Mar | Apr | May | Jun | Jul | Aug | Sep | Oct | Nov | Dec |
|---|---|---|---|---|---|---|---|---|---|---|---|---|
| 1983 | 0.998 | 0.964 | 0.927 | 0.948 | 0.974 | 0.979 | 0.996 | 0.997 | 0.995 | 0.984 | 0.967 | 0.935 |
| 1984 | 0.935 | 0.937 | 0.932 | 0.939 | 0.939 | 0.934 | 0.919 | 0.906 | 0.922 | 0.916 | 0.906 | 0.891 |
| 1985 | 0.877 | 0.875 | 0.903 | 0.940 | 0.951 | 0.957 | 0.960 | 0.947 | 0.952 | 0.947 | 0.955 | 0.953 |
| 1986 | 0.906 | 0.815 | 0.673 | 0.588 | 0.647 | 0.620 | 0.549 | 0.557 | 0.573 | 0.559 | 0.561 | 0.570 |
| 1987 | 0.611 | 0.635 | 0.653 | 0.670 | 0.691 | 0.707 | 0.728 | 0.735 | 0.712 | 0.704 | 0.706 | 0.680 |
| 1988 | 0.649 | 0.654 | 0.656 | 0.685 | 0.707 | 0.710 | 0.725 | 0.724 | 0.700 | 0.712 | 0.729 | 0.716 |
| 1989 | 0.725 | 0.713 | 0.735 | 0.832 | 0.870 | 0.841 | 0.825 | 0.776 | 0.785 | 0.786 | 0.756 | 0.756 |
| 1990 | 0.821 | 0.808 | 0.773 | 0.806 | 0.832 | 0.847 | 0.851 | 0.958 | 1.059 | 1.141 | 1.123 | 0.992 |
| 1991 | 0.914 | 0.844 | 0.832 | 0.858 | 0.882 | 0.865 | 0.841 | 0.864 | 0.846 | 0.837 | 0.848 | 0.810 |
| 1992 | 0.768 | 0.765 | 0.750 | 0.763 | 0.814 | 0.847 | 0.825 | 0.824 | 0.828 | 0.836 | 0.838 | 0.795 |
| 1993 | 0.791 | 0.756 | 0.757 | 0.765 | 0.784 | 0.777 | 0.751 | 0.738 | 0.725 | 0.742 | 0.718 | 0.668 |
| 1994 | 0.654 | 0.663 | 0.657 | 0.677 | 0.698 | 0.729 | 0.760 | 0.788 | 0.753 | 0.773 | 0.796 | 0.760 |
| 1995 | 0.756 | 0.759 | 0.744 | 0.782 | 0.857 | 0.851 | 0.798 | 0.759 | 0.768 | 0.711 | 0.695 | 0.740 |
| 1996 | 0.744 | 0.745 | 0.783 | 0.862 | 0.897 | 0.844 | 0.843 | 0.827 | 0.827 | 0.853 | 0.884 | 0.897 |
| 1997 | 0.892 | 0.864 | 0.832 | 0.804 | 0.812 | 0.791 | 0.786 | 0.872 | 0.850 | 0.809 | 0.770 | 0.749 |
| 1998 | 0.714 | 0.669 | 0.627 | 0.650 | 0.668 | 0.651 | 0.649 | 0.627 | 0.619 | 0.632 | 0.605 | 0.558 |
| 1999 | 0.554 | 0.536 | 0.594 | 0.698 | 0.710 | 0.704 | 0.758 | 0.837 | 0.874 | 0.868 | 0.875 | 0.897 |
| 2000 | 0.910 | 0.951 | 1.096 | 1.030 | 1.096 | 1.198 | 1.178 | 1.135 | 1.164 | 1.143 | 1.128 | 1.027 |
| 2001 | 1.048 | 1.053 | 1.017 | 1.165 | 1.296 | 1.186 | 1.048 | 1.023 | 1.012 | 0.874 | 0.762 | 0.709 |
| 2002 | 0.734 | 0.741 | 0.855 | 1.004 | 1.008 | 0.981 | 1.007 | 1.027 | 1.031 | 1.059 | 1.050 | 1.048 |
| 2003 | 1.084 | 1.198 | 1.224 | 1.139 | 1.072 | 1.056 | 1.087 | 1.212 | 1.254 | 1.173 | 1.114 | 1.088 |
| 2004 | 1.186 | 1.235 | 1.308 | 1.341 | 1.574 | 1.528 | 1.501 | 1.486 | 1.462 | 1.574 | 1.513 | 1.348 |
| 2005 | 1.378 | 1.392 | 1.591 | 1.717 | 1.663 | 1.739 | 1.913 | 2.123 | 2.451 | 2.156 | 1.770 | 1.772 |
| 2006 | 1.928 | 1.787 | 1.961 | 2.375 | 2.492 | 2.522 | 2.627 | 2.514 | 1.983 | 1.738 | 1.816 | 1.921 |
| 2007 | 1.739 | 1.820 | 2.172 | 2.383 | 2.612 | 2.564 | 2.540 | 2.354 | 2.357 | 2.370 | 2.614 | 2.542 |
| 2008 | 2.583 | 2.584 | 2.776 | 3.011 | 3.388 | 3.629 | 3.541 | 3.233 | 3.154 | 2.360 | 1.685 | 1.282 |
| 2009 | 1.344 | 1.501 | 1.558 | 1.651 | 1.923 | 2.211 | 2.053 | 2.229 | 2.095 | 2.136 | 2.239 | 2.183 |
| 2010 | 2.273 | 2.202 | 2.326 | 2.425 | 2.366 | 2.292 | 2.267 | 2.237 | 2.207 | 2.382 | 2.439 | 2.612 |
| 2011 | 2.676 | 2.745 | 3.073 | 3.404 | 3.412 | 3.235 | 3.338 | 3.201 | 3.135 | 3.014 | 2.922 | 2.855 |
| 2012 | 3.001 | 3.188 | 3.365 | 3.458 | 3.235 | 3.003 | 3.164 | 3.411 | 3.487 | 3.237 | 3.028 | 2.964 |
| 2013 | 3.064 | 3.327 | 3.244 | 3.069 | 3.131 | 3.114 | 3.251 | 3.207 | 3.074 | 2.904 | 2.880 | 2.985 |
| 2014 | 2.911 | 2.976 | 3.089 | 3.185 | 3.194 | 3.248 | 3.139 | 2.980 | 2.918 | 2.634 | 2.417 | 2.015 |
| 2015 | 1.617 | 1.783 | 1.910 | 2.021 | 2.253 | 2.350 | 2.348 | 2.110 | 1.894 | 1.755 | 1.679 | 1.584 |
| 2016 | 1.419 | 1.251 | 1.452 | 1.683 | 1.827 | 1.822 | 1.687 | 1.691 | 1.681 | 1.775 | 1.702 | 1.825 |
| 2017 | 1.838 | 1.783 | 1.759 | 1.905 | 1.866 | 1.775 | 1.833 | 1.900 | 2.109 | 1.901 | 2.007 | 1.908 |
| 2018 | 2.038 | 2.008 | 2.027 | 2.216 | 2.399 | 2.340 | 2.372 | 2.333 | 2.328 | 2.244 | 1.908 | 1.710 |
| 2019 | 1.674 | 1.780 | 2.012 | 2.249 | 2.304 | 2.136 | 2.274 | 2.099 | 2.036 | 2.012 | 2.009 | 1.992 |
| 2020 | 1.951 | 1.840 | 1.333 | 0.922 | 1.234 | 1.475 | 1.558 | 1.543 | 1.478 | 1.464 | 1.427 | 1.541 |
| 2021 | 1.738 | 1.936 | 2.115 | 2.152 | 2.344 | 2.390 | 2.443 | 2.444 | 2.485 | 2.686 | 2.733 | 2.536 |
| 2022 | 2.597 | 2.834 | 3.339 | |||||||||
| - = No Data Reported; -- = Not Applicable; NA = Not Available; W = Withheld to avoid disclosure of individual company data. |
| Release Date: 6/1/2022 |
| Next Release Date: TBD |