|
Download Data (XLS File) |
|
||||||||
|
||||||||
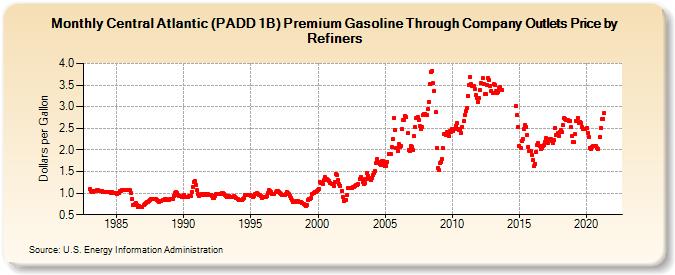
| Central Atlantic (PADD 1B) Premium Gasoline Through Company Outlets Price by Refiners (Dollars per Gallon) | ||||||||
| Year | Jan | Feb | Mar | Apr | May | Jun | Jul | Aug | Sep | Oct | Nov | Dec |
|---|---|---|---|---|---|---|---|---|---|---|---|---|
| 1983 | 1.094 | 1.049 | 1.029 | 1.026 | 1.043 | 1.055 | 1.066 | 1.067 | 1.056 | 1.040 | 1.049 | 1.053 |
| 1984 | 1.017 | 1.027 | 1.020 | 1.028 | 1.033 | 1.036 | 1.032 | 1.014 | 1.016 | 1.014 | 1.011 | 1.005 |
| 1985 | 0.988 | 0.995 | 1.010 | 1.039 | 1.054 | 1.071 | 1.079 | 1.076 | 1.070 | 1.069 | 1.062 | 1.067 |
| 1986 | 1.063 | 1.007 | 0.859 | 0.722 | 0.747 | 0.779 | 0.725 | 0.681 | 0.692 | 0.675 | 0.674 | 0.680 |
| 1987 | 0.723 | 0.757 | 0.771 | 0.790 | 0.800 | 0.825 | 0.844 | 0.871 | 0.873 | 0.867 | 0.869 | 0.853 |
| 1988 | 0.841 | 0.822 | 0.805 | 0.813 | 0.825 | 0.838 | 0.849 | 0.858 | 0.854 | 0.846 | 0.851 | 0.850 |
| 1989 | 0.858 | 0.863 | 0.869 | 0.941 | 1.012 | 1.021 | 1.006 | 0.957 | 0.932 | 0.926 | 0.914 | 0.917 |
| 1990 | 0.955 | 0.914 | 0.901 | 0.903 | 0.915 | 0.941 | 0.941 | 1.030 | 1.149 | 1.261 | 1.273 | 1.199 |
| 1991 | 1.064 | 0.971 | 0.937 | 0.960 | 0.987 | 0.986 | 0.966 | 0.973 | 0.976 | 0.955 | 0.969 | 0.946 |
| 1992 | 0.958 | 0.922 | 0.897 | 0.897 | 0.933 | 0.972 | 0.986 | 0.989 | 0.983 | 0.990 | 1.008 | 0.997 |
| 1993 | 0.976 | 0.950 | 0.923 | 0.918 | 0.925 | 0.914 | 0.907 | 0.917 | 0.906 | 0.925 | 0.905 | 0.879 |
| 1994 | 0.854 | 0.851 | 0.840 | 0.841 | 0.843 | 0.855 | 0.884 | 0.948 | 0.953 | 0.947 | 0.960 | 0.965 |
| 1995 | 0.939 | 0.931 | 0.918 | 0.929 | 0.987 | 0.999 | 0.987 | 0.953 | 0.950 | 0.927 | 0.895 | 0.900 |
| 1996 | 0.916 | 0.911 | 0.929 | 1.004 | 1.063 | 1.055 | 1.019 | 0.979 | 0.969 | 0.981 | 1.019 | 1.050 |
| 1997 | 1.055 | 1.036 | 1.003 | 0.974 | 0.958 | 0.953 | 0.952 | 0.987 | 1.037 | 1.001 | 0.968 | 0.930 |
| 1998 | 0.889 | 0.833 | 0.789 | 0.801 | 0.815 | 0.823 | 0.813 | 0.801 | 0.786 | 0.791 | 0.782 | 0.748 |
| 1999 | 0.733 | 0.705 | 0.729 | 0.838 | 0.872 | 0.863 | 0.897 | 0.968 | 1.014 | 1.036 | 1.031 | 1.059 |
| 2000 | 1.068 | 1.104 | 1.250 | 1.235 | 1.215 | 1.297 | 1.365 | 1.320 | 1.318 | 1.297 | 1.282 | 1.243 |
| 2001 | 1.209 | 1.203 | 1.169 | 1.259 | 1.433 | 1.417 | 1.298 | 1.200 | 1.172 | 1.050 | 0.917 | 0.828 |
| 2002 | 0.840 | 0.846 | 0.945 | 1.108 | 1.121 | 1.108 | 1.114 | 1.147 | 1.152 | 1.166 | 1.184 | 1.184 |
| 2003 | 1.221 | 1.328 | 1.377 | 1.331 | 1.257 | 1.211 | 1.227 | 1.335 | 1.472 | 1.397 | 1.336 | 1.302 |
| 2004 | 1.353 | 1.414 | 1.475 | 1.509 | 1.700 | 1.789 | 1.726 | 1.677 | 1.645 | 1.739 | 1.746 | 1.676 |
| 2005 | 1.616 | 1.636 | 1.726 | 1.900 | 1.904 | 1.905 | 2.067 | 2.244 | 2.741 | 2.455 | 2.052 | 1.963 |
| 2006 | 2.130 | 2.075 | 2.100 | 2.481 | 2.699 | 2.686 | 2.781 | 2.755 | 2.382 | 2.007 | 1.979 | 2.101 |
| 2007 | 2.063 | 2.009 | 2.311 | 2.523 | 2.737 | 2.763 | 2.701 | 2.561 | 2.492 | 2.526 | 2.797 | 2.833 |
| 2008 | 2.837 | 2.805 | 2.937 | 3.113 | 3.525 | 3.806 | 3.831 | 3.539 | 3.359 | 2.868 | 2.054 | 1.578 |
| 2009 | 1.530 | 1.688 | 1.713 | 1.795 | 2.036 | 2.379 | 2.352 | 2.411 | 2.382 | 2.318 | 2.438 | 2.413 |
| 2010 | 2.484 | 2.435 | 2.490 | 2.560 | 2.617 | 2.490 | 2.466 | 2.459 | 2.393 | 2.531 | 2.662 | 2.811 |
| 2011 | 2.896 | 2.959 | 3.256 | 3.512 | 3.687 | 3.515 | 3.483 | 3.470 | 3.410 | 3.260 | 3.207 | 3.105 |
| 2012 | 3.190 | 3.377 | 3.540 | 3.655 | 3.524 | 3.293 | 3.292 | 3.501 | 3.669 | 3.629 | 3.488 | 3.362 |
| 2013 | 3.318 | 3.517 | 3.506 | 3.358 | 3.314 | 3.335 | 3.430 | 3.453 | 3.397 | NA | NA | W |
| 2014 | W | W | W | W | W | W | W | W | W | 3.009 | 2.807 | 2.541 |
| 2015 | 2.094 | 2.050 | 2.197 | 2.256 | 2.483 | 2.572 | 2.538 | 2.345 | 2.068 | 1.975 | 1.963 | 1.892 |
| 2016 | 1.768 | 1.616 | 1.682 | 1.962 | 2.114 | 2.155 | 2.087 | 2.017 | 2.039 | 2.086 | 2.106 | 2.181 |
| 2017 | 2.271 | 2.204 | 2.154 | 2.248 | 2.245 | 2.195 | 2.156 | 2.223 | 2.516 | 2.338 | 2.384 | 2.324 |
| 2018 | 2.409 | 2.453 | 2.404 | 2.567 | 2.747 | 2.726 | 2.694 | 2.683 | 2.678 | 2.674 | 2.519 | 2.316 |
| 2019 | 2.184 | 2.182 | 2.365 | 2.661 | 2.746 | 2.630 | 2.653 | 2.616 | 2.533 | 2.490 | 2.486 | 2.475 |
| 2020 | 2.509 | 2.401 | 2.288 | 2.050 | 2.015 | 2.073 | 2.090 | 2.081 | 2.100 | 2.047 | 2.020 | NA |
| 2021 | 2.303 | 2.508 | 2.721 | 2.723 | 2.853 | W | W | W | W | W | W | W |
| 2022 | W | W | W | |||||||||
| - = No Data Reported; -- = Not Applicable; NA = Not Available; W = Withheld to avoid disclosure of individual company data. |
| Release Date: 6/1/2022 |
| Next Release Date: TBD |