|
Download Data (XLS File) |
|
||||||||
|
||||||||
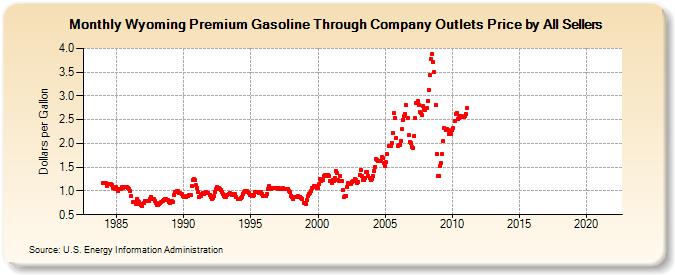
| Wyoming Premium Gasoline Through Company Outlets Price by All Sellers (Dollars per Gallon) | ||||||||
| Year | Jan | Feb | Mar | Apr | May | Jun | Jul | Aug | Sep | Oct | Nov | Dec |
|---|---|---|---|---|---|---|---|---|---|---|---|---|
| 1983 | W | W | W | W | W | W | W | W | W | W | W | W |
| 1984 | 1.172 | 1.169 | 1.171 | 1.095 | 1.152 | 1.144 | 1.150 | 1.138 | 1.131 | 1.065 | 1.044 | 1.081 |
| 1985 | 1.041 | 1.002 | 1.033 | 1.041 | 1.043 | 1.073 | 1.063 | 1.081 | 1.091 | 1.082 | 1.058 | 1.032 |
| 1986 | 1.008 | 0.896 | W | 0.775 | 0.761 | 0.735 | 0.831 | 0.780 | 0.762 | 0.735 | 0.704 | 0.693 |
| 1987 | 0.739 | 0.786 | 0.786 | 0.798 | 0.792 | 0.785 | 0.831 | 0.872 | 0.829 | 0.824 | 0.786 | 0.751 |
| 1988 | 0.705 | 0.710 | 0.715 | 0.745 | 0.777 | 0.790 | 0.819 | 0.840 | 0.835 | 0.820 | 0.805 | 0.778 |
| 1989 | 0.756 | 0.779 | 0.777 | 0.913 | 0.970 | 0.988 | 1.000 | 0.994 | 0.967 | 0.952 | 0.928 | 0.891 |
| 1990 | 0.878 | 0.871 | 0.866 | 0.890 | 0.896 | 0.919 | 0.906 | 1.106 | 1.220 | 1.262 | 1.227 | 1.119 |
| 1991 | 1.052 | 0.972 | 0.869 | 0.904 | 0.934 | 0.952 | 0.940 | 0.952 | 0.968 | 0.952 | 0.962 | 0.921 |
| 1992 | 0.867 | 0.835 | 0.859 | 0.898 | 0.975 | 1.046 | 1.075 | 1.058 | 1.042 | 1.019 | 0.987 | 0.940 |
| 1993 | 0.898 | 0.865 | 0.883 | 0.920 | 0.937 | 0.948 | 0.942 | 0.921 | 0.922 | 0.937 | 0.926 | 0.881 |
| 1994 | 0.830 | 0.834 | 0.827 | 0.842 | 0.882 | 0.929 | 0.975 | 0.993 | 1.006 | 0.986 | 0.950 | 0.921 |
| 1995 | 0.909 | 0.891 | 0.897 | 0.922 | 0.968 | 0.978 | 0.974 | 0.965 | 0.966 | 0.968 | 0.944 | 0.895 |
| 1996 | 0.889 | 0.889 | 0.939 | 1.041 | 1.098 | 1.065 | 1.046 | 1.053 | 1.064 | 1.064 | 1.072 | 1.062 |
| 1997 | 1.048 | 1.057 | 1.040 | 1.038 | 1.051 | 1.052 | 1.031 | 1.044 | 1.047 | 1.043 | 1.001 | 0.972 |
| 1998 | 0.904 | 0.865 | 0.841 | 0.863 | 0.879 | 0.872 | 0.890 | 0.882 | 0.878 | 0.853 | 0.832 | 0.755 |
| 1999 | 0.746 | 0.727 | 0.800 | 0.896 | 0.945 | 0.965 | 1.003 | 1.071 | 1.104 | 1.109 | 1.083 | 1.072 |
| 2000 | 1.063 | 1.151 | 1.250 | 1.208 | 1.232 | 1.320 | 1.335 | 1.308 | 1.325 | 1.332 | 1.318 | 1.212 |
| 2001 | 1.170 | 1.224 | 1.204 | 1.281 | 1.420 | 1.381 | 1.231 | 1.213 | 1.310 | 1.202 | 1.020 | 0.868 |
| 2002 | 0.891 | 0.897 | 1.083 | 1.161 | 1.152 | 1.148 | 1.179 | 1.203 | 1.217 | 1.246 | 1.224 | 1.174 |
| 2003 | 1.198 | 1.343 | 1.438 | 1.309 | 1.239 | 1.236 | 1.276 | 1.389 | 1.394 | 1.315 | 1.271 | 1.237 |
| 2004 | 1.247 | 1.325 | 1.418 | 1.513 | 1.666 | 1.659 | 1.635 | 1.637 | 1.626 | 1.719 | 1.686 | 1.580 |
| 2005 | 1.528 | 1.602 | 1.768 | 1.937 | 1.956 | 1.936 | 2.015 | 2.218 | 2.638 | 2.539 | 2.113 | 1.939 |
| 2006 | 1.957 | 1.973 | 2.057 | 2.302 | 2.498 | 2.578 | 2.626 | 2.803 | 2.537 | 2.167 | 2.028 | 2.007 |
| 2007 | 1.929 | 1.899 | 2.165 | 2.526 | 2.854 | 2.891 | 2.813 | 2.666 | 2.642 | 2.597 | 2.787 | 2.729 |
| 2008 | 2.708 | 2.742 | 2.901 | 3.132 | 3.432 | 3.786 | 3.882 | 3.708 | 3.499 | 2.811 | 1.788 | 1.311 |
| 2009 | 1.320 | 1.520 | 1.592 | 1.775 | 2.047 | 2.325 | 2.278 | 2.314 | 2.282 | 2.189 | 2.255 | 2.194 |
| 2010 | 2.277 | 2.319 | 2.473 | 2.616 | 2.646 | 2.522 | 2.525 | 2.579 | 2.570 | 2.551 | 2.546 | 2.569 |
| 2011 | 2.628 | 2.737 | - | - | - | - | - | - | - | - | - | - |
| 2012 | - | - | - | - | - | - | - | - | - | - | - | - |
| 2013 | - | - | - | - | - | - | - | - | - | - | - | - |
| 2014 | - | - | - | - | - | - | - | - | - | - | - | - |
| 2015 | - | - | - | - | - | - | - | - | - | - | - | - |
| 2016 | - | - | - | - | - | - | - | - | - | - | - | - |
| 2017 | - | - | - | - | - | - | - | - | - | - | - | - |
| 2018 | - | - | - | - | - | - | - | - | - | - | - | - |
| 2019 | - | - | - | - | - | - | - | - | - | - | - | - |
| 2020 | - | - | - | - | - | - | - | - | - | - | - | - |
| 2021 | - | - | - | - | - | - | - | - | - | - | - | - |
| 2022 | - | - | - | |||||||||
| - = No Data Reported; -- = Not Applicable; NA = Not Available; W = Withheld to avoid disclosure of individual company data. |
| Release Date: 6/1/2022 |
| Next Release Date: TBD |