|
Download Data (XLS File) |
|
||||||||
|
||||||||
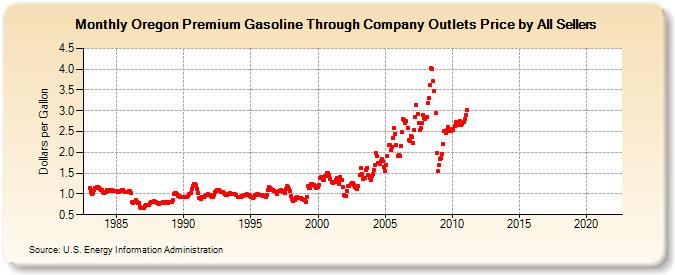
| Oregon Premium Gasoline Through Company Outlets Price by All Sellers (Dollars per Gallon) | ||||||||
| Year | Jan | Feb | Mar | Apr | May | Jun | Jul | Aug | Sep | Oct | Nov | Dec |
|---|---|---|---|---|---|---|---|---|---|---|---|---|
| 1983 | 1.136 | 1.051 | 1.007 | 1.021 | 1.083 | 1.131 | 1.166 | 1.164 | 1.150 | 1.121 | 1.098 | 1.085 |
| 1984 | 1.046 | 1.014 | 1.047 | 1.089 | 1.105 | 1.095 | 1.082 | 1.083 | 1.084 | 1.082 | 1.072 | 1.082 |
| 1985 | 1.076 | 1.037 | 1.039 | 1.061 | 1.082 | 1.090 | 1.103 | 1.051 | 1.052 | 1.050 | 1.056 | 1.065 |
| 1986 | 1.066 | 1.024 | 0.814 | 0.788 | 0.813 | 0.846 | 0.801 | 0.771 | 0.771 | 0.697 | 0.662 | 0.654 |
| 1987 | 0.673 | 0.716 | 0.729 | 0.737 | 0.738 | 0.729 | 0.774 | 0.798 | 0.813 | 0.821 | 0.805 | 0.806 |
| 1988 | 0.788 | 0.775 | 0.765 | 0.776 | 0.792 | 0.802 | 0.792 | 0.807 | 0.811 | 0.814 | 0.792 | 0.795 |
| 1989 | 0.799 | 0.814 | 0.851 | 0.987 | 1.029 | 1.014 | 0.995 | 0.962 | 0.950 | 0.931 | 0.919 | 0.916 |
| 1990 | 0.915 | 0.918 | 0.917 | 0.936 | 0.955 | 0.992 | 1.029 | 1.116 | 1.183 | 1.240 | 1.233 | 1.203 |
| 1991 | 1.129 | 1.020 | 0.897 | 0.888 | 0.934 | 0.936 | 0.918 | 0.950 | 0.986 | 0.985 | 0.987 | 0.972 |
| 1992 | 0.955 | 0.934 | 0.925 | 0.968 | 1.053 | 1.082 | 1.094 | 1.091 | 1.075 | 1.050 | 1.050 | 1.038 |
| 1993 | 1.019 | 0.994 | 0.966 | 0.965 | 1.002 | 1.012 | 1.001 | 1.005 | 1.004 | 1.003 | 0.992 | 0.963 |
| 1994 | 0.930 | 0.919 | 0.915 | 0.923 | 0.944 | 0.956 | 0.981 | 0.976 | 0.995 | 0.971 | 0.968 | 0.949 |
| 1995 | 0.930 | 0.922 | 0.909 | 0.932 | 0.974 | 0.987 | 0.987 | 0.967 | 0.971 | 0.977 | 0.976 | 0.960 |
| 1996 | 0.950 | 0.937 | 0.968 | 1.084 | 1.169 | 1.153 | 1.126 | 1.101 | 1.091 | 1.078 | 1.052 | 1.004 |
| 1997 | NA | 1.079 | 1.072 | 1.094 | 1.082 | 1.052 | 1.018 | 1.110 | 1.180 | 1.176 | 1.121 | 1.060 |
| 1998 | 0.949 | 0.873 | 0.820 | 0.843 | 0.911 | 0.914 | 0.910 | 0.901 | 0.897 | 0.894 | 0.873 | 0.858 |
| 1999 | 0.852 | 0.815 | 0.923 | 1.190 | 1.138 | 1.134 | 1.229 | 1.247 | 1.210 | 1.190 | 1.148 | 1.173 |
| 2000 | 1.162 | 1.223 | 1.391 | 1.402 | 1.341 | 1.336 | 1.427 | 1.420 | 1.501 | 1.502 | 1.452 | 1.369 |
| 2001 | 1.277 | 1.271 | 1.281 | 1.285 | 1.341 | 1.372 | 1.302 | 1.248 | 1.413 | 1.330 | 1.168 | 0.982 |
| 2002 | 0.960 | 0.946 | 1.075 | 1.183 | 1.194 | 1.229 | 1.257 | 1.257 | 1.215 | 1.160 | 1.154 | 1.123 |
| 2003 | 1.183 | 1.444 | 1.620 | 1.483 | 1.352 | 1.394 | 1.393 | 1.570 | 1.631 | 1.450 | 1.388 | 1.329 |
| 2004 | 1.424 | 1.476 | 1.564 | 1.701 | 1.978 | 1.917 | 1.749 | 1.725 | 1.781 | 1.843 | 1.783 | 1.640 |
| 2005 | 1.554 | 1.704 | 1.919 | 2.184 | 2.185 | 2.049 | 2.130 | 2.356 | 2.590 | 2.450 | 2.166 | 1.915 |
| 2006 | 1.935 | 1.911 | 2.152 | 2.478 | 2.812 | 2.771 | 2.708 | 2.747 | 2.589 | 2.289 | 2.265 | 2.404 |
| 2007 | 2.372 | 2.225 | 2.546 | 2.846 | 3.145 | 2.919 | 2.717 | 2.539 | 2.586 | 2.702 | 2.900 | 2.831 |
| 2008 | 2.808 | 2.858 | 3.184 | 3.299 | 3.608 | 4.018 | 4.000 | 3.705 | 3.468 | 2.951 | 1.987 | 1.548 |
| 2009 | 1.689 | 1.840 | 1.853 | 1.961 | 2.189 | 2.515 | 2.466 | 2.541 | 2.620 | 2.515 | 2.530 | 2.502 |
| 2010 | 2.566 | 2.527 | 2.637 | 2.722 | 2.717 | 2.663 | 2.701 | 2.745 | 2.662 | 2.686 | 2.729 | 2.795 |
| 2011 | 2.901 | 3.026 | - | - | - | - | - | - | - | - | - | - |
| 2012 | - | - | - | - | - | - | - | - | - | - | - | - |
| 2013 | - | - | - | - | - | - | - | - | - | - | - | - |
| 2014 | - | - | - | - | - | - | - | - | - | - | - | - |
| 2015 | - | - | - | - | - | - | - | - | - | - | - | - |
| 2016 | - | - | - | - | - | - | - | - | - | - | - | - |
| 2017 | - | - | - | - | - | - | - | - | - | - | - | - |
| 2018 | - | - | - | - | - | - | - | - | - | - | - | - |
| 2019 | - | - | - | - | - | - | - | - | - | - | - | - |
| 2020 | - | - | - | - | - | - | - | - | - | - | - | - |
| 2021 | - | - | - | - | - | - | - | - | - | - | - | - |
| 2022 | - | - | - | |||||||||
| - = No Data Reported; -- = Not Applicable; NA = Not Available; W = Withheld to avoid disclosure of individual company data. |
| Release Date: 6/1/2022 |
| Next Release Date: TBD |