|
Download Data (XLS File) |
|
||||||||
|
||||||||
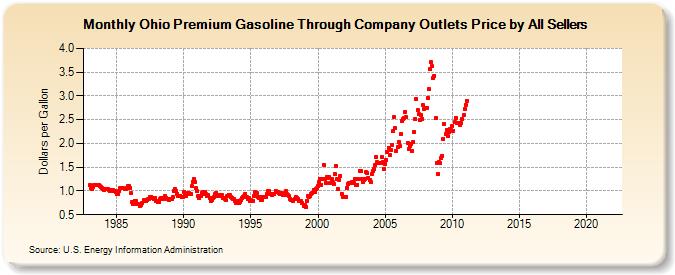
| Ohio Premium Gasoline Through Company Outlets Price by All Sellers (Dollars per Gallon) | ||||||||
| Year | Jan | Feb | Mar | Apr | May | Jun | Jul | Aug | Sep | Oct | Nov | Dec |
|---|---|---|---|---|---|---|---|---|---|---|---|---|
| 1983 | 1.119 | 1.072 | 1.048 | 1.085 | 1.123 | 1.132 | 1.132 | 1.130 | 1.121 | 1.100 | 1.080 | 1.062 |
| 1984 | 1.036 | 1.019 | 1.031 | 1.044 | 1.033 | 1.025 | 1.000 | 1.011 | 1.005 | 1.014 | 0.999 | 0.976 |
| 1985 | 0.932 | 0.939 | 1.003 | 1.059 | 1.059 | 1.058 | 1.064 | 1.041 | 1.045 | 1.058 | 1.098 | 1.098 |
| 1986 | 1.061 | 0.952 | 0.778 | 0.728 | 0.799 | 0.785 | 0.721 | 0.721 | 0.724 | 0.686 | 0.696 | 0.746 |
| 1987 | 0.803 | 0.799 | 0.798 | 0.815 | 0.826 | 0.836 | 0.869 | 0.873 | 0.853 | 0.839 | 0.848 | 0.798 |
| 1988 | 0.794 | 0.770 | 0.765 | 0.823 | 0.851 | 0.829 | 0.862 | 0.888 | 0.859 | 0.834 | 0.840 | 0.819 |
| 1989 | 0.822 | 0.830 | 0.863 | 1.002 | 1.039 | 0.997 | 0.945 | 0.891 | 0.895 | 0.900 | 0.873 | 0.878 |
| 1990 | 0.988 | 0.918 | 0.901 | 0.931 | 0.964 | 0.950 | 0.933 | 1.098 | 1.195 | 1.248 | 1.191 | 1.058 |
| 1991 | 0.991 | 0.893 | 0.845 | 0.894 | 0.957 | 0.971 | 0.929 | 0.970 | 0.935 | 0.901 | 0.908 | 0.860 |
| 1992 | 0.786 | 0.807 | 0.853 | 0.883 | 0.926 | 0.957 | 0.901 | 0.912 | 0.918 | 0.889 | 0.910 | 0.859 |
| 1993 | 0.843 | 0.830 | 0.803 | 0.894 | 0.924 | 0.909 | 0.873 | 0.860 | 0.826 | 0.841 | 0.779 | 0.750 |
| 1994 | 0.787 | 0.749 | 0.776 | 0.808 | 0.844 | 0.879 | 0.903 | 0.946 | 0.882 | 0.838 | 0.849 | 0.795 |
| 1995 | 0.811 | 0.793 | 0.786 | 0.892 | 0.969 | 0.949 | 0.874 | 0.857 | 0.867 | 0.815 | 0.809 | 0.867 |
| 1996 | 0.868 | 0.863 | 0.941 | 0.996 | 1.009 | 0.938 | 0.927 | 0.905 | 0.938 | 0.934 | 1.009 | 0.971 |
| 1997 | 0.981 | 0.947 | 0.934 | 0.933 | 0.956 | 0.925 | 0.908 | 0.998 | 0.935 | 0.909 | 0.887 | 0.827 |
| 1998 | 0.805 | 0.805 | 0.799 | 0.825 | 0.870 | 0.856 | 0.834 | 0.791 | 0.781 | 0.795 | 0.745 | 0.686 |
| 1999 | 0.705 | 0.660 | 0.798 | 0.890 | 0.878 | 0.889 | 0.942 | 0.967 | 1.030 | 0.970 | 1.044 | 1.056 |
| 2000 | 1.099 | 1.196 | 1.243 | 1.131 | 1.252 | 1.552 | 1.259 | 1.168 | 1.303 | 1.264 | 1.293 | 1.173 |
| 2001 | 1.254 | 1.189 | 1.151 | 1.354 | 1.529 | 1.245 | 1.050 | 1.237 | 1.322 | 0.944 | 0.883 | 0.871 |
| 2002 | 0.870 | 0.875 | 1.072 | 1.143 | 1.170 | 1.170 | 1.188 | 1.159 | 1.174 | 1.244 | 1.131 | 1.133 |
| 2003 | 1.247 | 1.421 | 1.411 | 1.259 | 1.189 | 1.234 | 1.252 | 1.395 | 1.373 | 1.275 | 1.229 | 1.181 |
| 2004 | 1.361 | 1.427 | 1.468 | 1.547 | 1.720 | 1.603 | 1.590 | 1.582 | 1.598 | 1.717 | 1.618 | 1.462 |
| 2005 | 1.576 | 1.642 | 1.823 | 1.914 | 1.767 | 1.859 | 1.969 | 2.254 | 2.557 | 2.319 | 1.846 | 1.930 |
| 2006 | 2.030 | 1.937 | 2.194 | 2.481 | 2.513 | 2.525 | 2.670 | 2.546 | 2.006 | 1.886 | 1.954 | 1.995 |
| 2007 | 1.839 | 2.034 | 2.247 | 2.518 | 2.944 | 2.708 | 2.612 | 2.502 | 2.591 | 2.524 | 2.802 | 2.726 |
| 2008 | 2.756 | 2.749 | 2.957 | 3.135 | 3.557 | 3.705 | 3.624 | 3.381 | 3.425 | 2.532 | 1.589 | 1.359 |
| 2009 | 1.604 | 1.584 | 1.684 | 1.743 | 2.102 | 2.401 | 2.198 | 2.279 | 2.165 | 2.235 | 2.295 | 2.288 |
| 2010 | 2.368 | 2.270 | 2.443 | 2.536 | 2.437 | 2.427 | 2.424 | 2.382 | 2.420 | 2.509 | 2.597 | 2.716 |
| 2011 | 2.812 | 2.894 | - | - | - | - | - | - | - | - | - | - |
| 2012 | - | - | - | - | - | - | - | - | - | - | - | - |
| 2013 | - | - | - | - | - | - | - | - | - | - | - | - |
| 2014 | - | - | - | - | - | - | - | - | - | - | - | - |
| 2015 | - | - | - | - | - | - | - | - | - | - | - | - |
| 2016 | - | - | - | - | - | - | - | - | - | - | - | - |
| 2017 | - | - | - | - | - | - | - | - | - | - | - | - |
| 2018 | - | - | - | - | - | - | - | - | - | - | - | - |
| 2019 | - | - | - | - | - | - | - | - | - | - | - | - |
| 2020 | - | - | - | - | - | - | - | - | - | - | - | - |
| 2021 | - | - | - | - | - | - | - | - | - | - | - | - |
| 2022 | - | - | - | |||||||||
| - = No Data Reported; -- = Not Applicable; NA = Not Available; W = Withheld to avoid disclosure of individual company data. |
| Release Date: 6/1/2022 |
| Next Release Date: TBD |