|
Download Data (XLS File) |
|
||||||||
|
||||||||
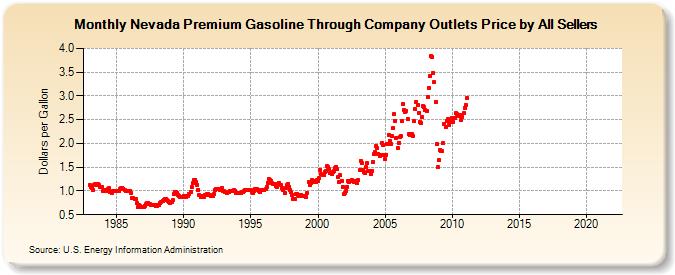
| Nevada Premium Gasoline Through Company Outlets Price by All Sellers (Dollars per Gallon) | ||||||||
| Year | Jan | Feb | Mar | Apr | May | Jun | Jul | Aug | Sep | Oct | Nov | Dec |
|---|---|---|---|---|---|---|---|---|---|---|---|---|
| 1983 | 1.125 | 1.084 | 1.069 | 1.027 | 1.121 | 1.147 | 1.118 | 1.152 | 1.125 | 1.083 | 1.074 | 1.085 |
| 1984 | 1.007 | 1.015 | 0.995 | 1.027 | 1.032 | 1.052 | 0.978 | 0.973 | 0.965 | 1.000 | 1.004 | 1.003 |
| 1985 | 0.996 | 0.989 | 0.995 | 1.034 | 1.062 | 1.065 | 1.047 | 1.017 | 0.998 | 0.993 | 1.001 | 1.009 |
| 1986 | 1.001 | 0.958 | 0.861 | 0.848 | 0.841 | 0.836 | 0.743 | 0.660 | 0.702 | 0.674 | 0.659 | 0.656 |
| 1987 | 0.668 | 0.692 | 0.720 | 0.746 | 0.753 | 0.724 | 0.717 | 0.710 | 0.699 | 0.713 | 0.712 | 0.683 |
| 1988 | 0.686 | 0.694 | 0.701 | 0.739 | 0.773 | 0.790 | 0.813 | 0.827 | 0.834 | 0.811 | 0.786 | 0.763 |
| 1989 | 0.751 | 0.763 | 0.801 | 0.940 | 0.978 | 0.983 | 0.957 | 0.922 | 0.888 | 0.875 | 0.876 | 0.875 |
| 1990 | 0.900 | 0.896 | 0.878 | 0.889 | 0.904 | 0.933 | 0.985 | 1.076 | 1.164 | 1.225 | 1.236 | 1.198 |
| 1991 | 1.128 | 1.027 | 0.906 | 0.864 | 0.891 | 0.902 | 0.880 | 0.906 | 0.911 | 0.939 | 0.932 | 0.908 |
| 1992 | 0.884 | 0.895 | 0.901 | 0.944 | 1.013 | 1.047 | 1.045 | 1.033 | 1.025 | 1.050 | 1.061 | 1.003 |
| 1993 | 0.989 | 0.977 | 0.971 | 0.958 | 0.984 | 1.000 | 1.003 | 0.998 | 1.004 | 1.019 | 1.007 | 0.961 |
| 1994 | 0.950 | 0.949 | 0.963 | 0.961 | 0.971 | 0.981 | 0.993 | 1.018 | 1.015 | 1.014 | 1.026 | 1.029 |
| 1995 | 1.020 | 0.985 | 0.961 | 0.989 | 1.048 | 1.039 | 1.023 | 1.008 | 0.983 | 1.011 | 1.011 | 1.010 |
| 1996 | 1.018 | 1.035 | 1.081 | 1.171 | 1.262 | 1.229 | 1.208 | 1.165 | 1.156 | 1.156 | 1.109 | 1.091 |
| 1997 | 1.148 | 1.170 | NA | 1.120 | 1.066 | 1.022 | 0.963 | 1.058 | 1.124 | 1.151 | 1.091 | 1.030 |
| 1998 | 0.969 | 0.922 | 0.830 | 0.841 | 0.927 | 0.944 | 0.914 | 0.886 | 0.921 | 0.912 | 0.903 | 0.902 |
| 1999 | 0.902 | 0.883 | 0.949 | NA | 1.179 | 1.118 | 1.176 | 1.229 | 1.205 | 1.181 | 1.198 | 1.223 |
| 2000 | 1.201 | 1.263 | 1.451 | 1.355 | 1.329 | 1.339 | 1.408 | 1.425 | 1.520 | 1.503 | 1.460 | 1.374 |
| 2001 | 1.354 | 1.389 | 1.429 | 1.478 | 1.511 | 1.461 | 1.284 | 1.180 | 1.328 | 1.218 | 1.085 | 0.935 |
| 2002 | 0.964 | 1.006 | 1.093 | 1.204 | 1.191 | 1.219 | 1.233 | 1.204 | 1.197 | 1.183 | 1.211 | 1.167 |
| 2003 | 1.222 | 1.432 | 1.636 | 1.579 | 1.437 | 1.392 | 1.373 | 1.503 | 1.581 | 1.424 | 1.412 | 1.364 |
| 2004 | 1.419 | 1.606 | 1.773 | 1.814 | 1.951 | 1.897 | 1.779 | 1.737 | 1.762 | 2.012 | 1.976 | 1.750 |
| 2005 | 1.665 | 1.764 | 1.979 | 2.181 | 2.058 | 1.994 | 2.150 | 2.322 | 2.610 | 2.478 | 2.120 | 1.900 |
| 2006 | 2.019 | 2.127 | 2.149 | 2.473 | 2.826 | 2.695 | 2.671 | 2.687 | 2.509 | 2.197 | 2.169 | 2.199 |
| 2007 | 2.189 | 2.149 | 2.465 | 2.717 | 2.874 | 2.808 | 2.650 | 2.451 | 2.434 | 2.560 | 2.797 | 2.766 |
| 2008 | 2.708 | 2.684 | 2.986 | 3.170 | 3.418 | 3.838 | 3.819 | 3.487 | 3.286 | 2.869 | 1.979 | 1.494 |
| 2009 | 1.642 | 1.870 | 1.832 | 1.836 | 1.999 | 2.400 | 2.350 | 2.477 | 2.507 | 2.395 | 2.455 | 2.459 |
| 2010 | 2.541 | 2.458 | 2.541 | 2.630 | 2.624 | 2.578 | 2.606 | 2.603 | 2.484 | 2.566 | 2.633 | 2.754 |
| 2011 | 2.812 | 2.960 | - | - | - | - | - | - | - | - | - | - |
| 2012 | - | - | - | - | - | - | - | - | - | - | - | - |
| 2013 | - | - | - | - | - | - | - | - | - | - | - | - |
| 2014 | - | - | - | - | - | - | - | - | - | - | - | - |
| 2015 | - | - | - | - | - | - | - | - | - | - | - | - |
| 2016 | - | - | - | - | - | - | - | - | - | - | - | - |
| 2017 | - | - | - | - | - | - | - | - | - | - | - | - |
| 2018 | - | - | - | - | - | - | - | - | - | - | - | - |
| 2019 | - | - | - | - | - | - | - | - | - | - | - | - |
| 2020 | - | - | - | - | - | - | - | - | - | - | - | - |
| 2021 | - | - | - | - | - | - | - | - | - | - | - | - |
| 2022 | - | - | - | |||||||||
| - = No Data Reported; -- = Not Applicable; NA = Not Available; W = Withheld to avoid disclosure of individual company data. |
| Release Date: 6/1/2022 |
| Next Release Date: TBD |