|
Download Data (XLS File) |
|
||||||||
|
||||||||
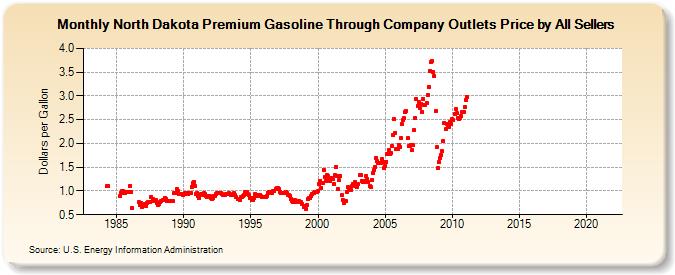
| North Dakota Premium Gasoline Through Company Outlets Price by All Sellers (Dollars per Gallon) | ||||||||
| Year | Jan | Feb | Mar | Apr | May | Jun | Jul | Aug | Sep | Oct | Nov | Dec |
|---|---|---|---|---|---|---|---|---|---|---|---|---|
| 1983 | W | - | - | - | - | - | - | - | - | - | - | - |
| 1984 | W | W | W | 1.104 | 1.112 | W | W | W | W | W | W | W |
| 1985 | W | W | W | 0.884 | 0.963 | 0.999 | 0.999 | 0.962 | 0.982 | 0.975 | 0.983 | 0.987 |
| 1986 | 1.111 | 0.985 | 0.646 | W | W | W | W | W | 0.760 | 0.708 | 0.744 | 0.660 |
| 1987 | 0.696 | 0.733 | 0.686 | 0.744 | 0.777 | 0.771 | 0.777 | 0.870 | 0.839 | 0.796 | 0.810 | 0.801 |
| 1988 | 0.748 | 0.714 | 0.735 | 0.758 | 0.799 | 0.803 | 0.815 | 0.852 | 0.834 | 0.786 | 0.794 | 0.786 |
| 1989 | 0.797 | 0.789 | 0.788 | 0.949 | 0.949 | 0.964 | 1.036 | 1.000 | 0.937 | 0.932 | 0.935 | 0.917 |
| 1990 | 0.940 | 0.960 | 0.932 | 0.953 | 0.926 | 0.954 | 0.951 | 1.088 | 1.171 | 1.195 | 1.104 | 0.936 |
| 1991 | 0.956 | 0.893 | 0.860 | 0.929 | 0.940 | 0.920 | 0.960 | 0.934 | 0.890 | 0.878 | 0.899 | 0.884 |
| 1992 | 0.844 | 0.827 | 0.852 | 0.889 | 0.900 | 0.927 | 0.965 | 0.963 | 0.961 | 0.953 | 0.946 | 0.922 |
| 1993 | 0.919 | 0.918 | 0.932 | 0.945 | 0.949 | 0.944 | 0.921 | 0.912 | 0.907 | 0.948 | 0.914 | 0.870 |
| 1994 | 0.841 | 0.837 | 0.814 | 0.863 | 0.877 | 0.885 | 0.909 | 0.972 | 0.977 | 0.930 | 0.908 | 0.858 |
| 1995 | 0.855 | 0.819 | 0.818 | 0.854 | 0.931 | 0.907 | 0.898 | 0.891 | 0.911 | 0.886 | 0.875 | 0.879 |
| 1996 | 0.869 | 0.873 | 0.896 | 0.959 | 0.980 | 0.969 | 0.958 | 0.961 | 1.001 | 0.998 | 1.042 | 1.060 |
| 1997 | 1.058 | 1.039 | 0.978 | 0.955 | 0.948 | 0.964 | 0.956 | 0.973 | 0.947 | 0.915 | 0.906 | 0.903 |
| 1998 | 0.837 | 0.784 | 0.778 | 0.818 | 0.776 | 0.795 | 0.798 | 0.781 | 0.761 | 0.759 | 0.727 | 0.661 |
| 1999 | 0.676 | 0.625 | 0.701 | 0.826 | 0.846 | 0.845 | 0.897 | 0.929 | 0.965 | 0.980 | 0.976 | 0.975 |
| 2000 | 1.002 | 1.138 | 1.205 | 1.057 | 1.168 | 1.451 | 1.298 | 1.211 | 1.339 | 1.309 | 1.278 | 1.209 |
| 2001 | 1.273 | 1.262 | 1.150 | 1.330 | 1.512 | 1.317 | 1.038 | 1.221 | 1.321 | 0.907 | 0.815 | 0.740 |
| 2002 | 0.783 | 0.779 | 0.982 | 1.074 | 1.036 | 1.024 | 1.103 | 1.153 | 1.127 | 1.184 | 1.108 | 1.081 |
| 2003 | 1.144 | 1.330 | 1.344 | 1.215 | 1.195 | 1.197 | 1.200 | 1.313 | 1.260 | 1.196 | 1.100 | 1.088 |
| 2004 | 1.240 | 1.374 | 1.431 | 1.506 | 1.692 | 1.625 | 1.590 | 1.590 | 1.581 | 1.664 | 1.614 | 1.492 |
| 2005 | 1.532 | 1.619 | 1.773 | 1.859 | 1.788 | 1.806 | 1.936 | 2.183 | 2.508 | 2.224 | 1.876 | 1.886 |
| 2006 | 1.961 | 1.932 | 2.107 | 2.400 | 2.491 | 2.527 | 2.657 | 2.684 | 2.104 | 1.938 | 1.944 | 1.971 |
| 2007 | 1.859 | 1.959 | 2.286 | 2.532 | 2.927 | 2.788 | 2.866 | 2.752 | 2.828 | 2.665 | 2.939 | 2.800 |
| 2008 | 2.813 | 2.860 | 3.019 | 3.192 | 3.528 | 3.708 | 3.734 | 3.499 | 3.409 | 2.672 | 1.916 | 1.475 |
| 2009 | 1.606 | 1.695 | 1.757 | 1.835 | 2.051 | 2.428 | 2.297 | 2.416 | 2.374 | 2.338 | 2.450 | 2.413 |
| 2010 | 2.511 | 2.489 | 2.622 | 2.721 | 2.634 | 2.537 | 2.524 | 2.539 | 2.567 | 2.661 | 2.658 | 2.766 |
| 2011 | 2.920 | 2.984 | - | - | - | - | - | - | - | - | - | - |
| 2012 | - | - | - | - | - | - | - | - | - | - | - | - |
| 2013 | - | - | - | - | - | - | - | - | - | - | - | - |
| 2014 | - | - | - | - | - | - | - | - | - | - | - | - |
| 2015 | - | - | - | - | - | - | - | - | - | - | - | - |
| 2016 | - | - | - | - | - | - | - | - | - | - | - | - |
| 2017 | - | - | - | - | - | - | - | - | - | - | - | - |
| 2018 | - | - | - | - | - | - | - | - | - | - | - | - |
| 2019 | - | - | - | - | - | - | - | - | - | - | - | - |
| 2020 | - | - | - | - | - | - | - | - | - | - | - | - |
| 2021 | - | - | - | - | - | - | - | - | - | - | - | - |
| 2022 | - | - | - | |||||||||
| - = No Data Reported; -- = Not Applicable; NA = Not Available; W = Withheld to avoid disclosure of individual company data. |
| Release Date: 6/1/2022 |
| Next Release Date: TBD |