|
Download Data (XLS File) |
|
||||||||
|
||||||||
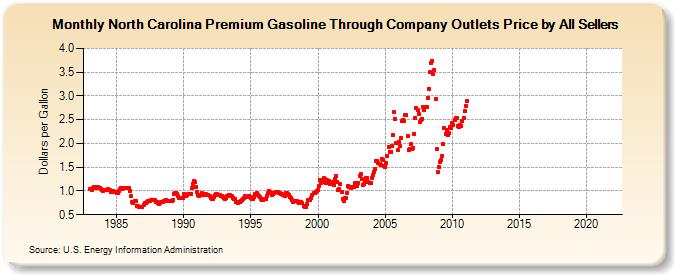
| North Carolina Premium Gasoline Through Company Outlets Price by All Sellers (Dollars per Gallon) | ||||||||
| Year | Jan | Feb | Mar | Apr | May | Jun | Jul | Aug | Sep | Oct | Nov | Dec |
|---|---|---|---|---|---|---|---|---|---|---|---|---|
| 1983 | 1.044 | 1.032 | 1.020 | 1.061 | 1.086 | 1.085 | 1.060 | 1.078 | 1.072 | 1.069 | 1.044 | 1.023 |
| 1984 | 1.008 | 1.014 | 1.016 | 1.027 | 1.031 | 1.019 | 1.011 | 0.982 | 0.999 | 0.997 | 0.988 | 0.974 |
| 1985 | 0.962 | 0.953 | 0.991 | 1.040 | 1.052 | 1.041 | 1.055 | 1.052 | 1.055 | 1.061 | 1.060 | 1.059 |
| 1986 | 1.006 | 0.897 | 0.778 | 0.740 | 0.786 | 0.785 | 0.684 | 0.685 | 0.671 | 0.660 | 0.667 | 0.668 |
| 1987 | 0.714 | 0.736 | 0.742 | 0.758 | 0.785 | 0.783 | 0.793 | 0.813 | 0.804 | 0.803 | 0.800 | 0.775 |
| 1988 | 0.775 | 0.745 | 0.733 | 0.755 | 0.774 | 0.775 | 0.799 | 0.798 | 0.818 | 0.795 | 0.799 | 0.795 |
| 1989 | 0.790 | 0.798 | 0.807 | 0.935 | 0.959 | 0.967 | 0.936 | 0.888 | 0.858 | 0.858 | 0.854 | 0.850 |
| 1990 | 0.933 | 0.911 | 0.889 | 0.907 | 0.930 | 0.940 | 0.942 | 1.060 | 1.151 | 1.209 | 1.183 | 1.089 |
| 1991 | 0.981 | 0.915 | 0.885 | 0.909 | 0.953 | 0.939 | 0.919 | 0.934 | 0.931 | 0.917 | 0.923 | 0.891 |
| 1992 | 0.850 | 0.835 | 0.831 | 0.868 | 0.913 | 0.946 | 0.931 | 0.921 | 0.914 | 0.896 | 0.903 | 0.875 |
| 1993 | 0.856 | 0.841 | 0.845 | 0.890 | 0.913 | 0.909 | 0.894 | 0.884 | 0.859 | 0.838 | 0.821 | 0.768 |
| 1994 | 0.751 | 0.774 | 0.774 | 0.796 | 0.801 | 0.835 | 0.854 | 0.885 | 0.877 | 0.863 | 0.890 | 0.870 |
| 1995 | 0.845 | 0.835 | 0.827 | 0.882 | 0.946 | 0.952 | 0.916 | 0.889 | 0.865 | 0.839 | 0.808 | 0.807 |
| 1996 | 0.831 | 0.832 | 0.885 | 0.962 | 1.004 | 0.978 | 0.962 | 0.923 | 0.928 | 0.951 | 0.971 | 0.977 |
| 1997 | 0.981 | 0.964 | 0.962 | 0.942 | 0.927 | 0.912 | 0.902 | 0.957 | 0.955 | 0.933 | 0.916 | 0.882 |
| 1998 | 0.847 | 0.804 | 0.770 | 0.782 | 0.795 | 0.785 | 0.778 | 0.753 | 0.739 | 0.759 | 0.736 | 0.683 |
| 1999 | 0.672 | 0.660 | 0.717 | 0.808 | 0.819 | 0.811 | 0.855 | 0.915 | 0.950 | 0.958 | 0.978 | 1.005 |
| 2000 | 1.012 | 1.100 | 1.236 | 1.176 | 1.191 | 1.266 | 1.253 | 1.168 | 1.224 | 1.218 | 1.205 | 1.139 |
| 2001 | 1.172 | 1.192 | 1.121 | 1.246 | 1.309 | 1.196 | 1.025 | 1.043 | 1.137 | 0.968 | 0.840 | 0.788 |
| 2002 | 0.843 | 0.849 | 0.963 | 1.105 | 1.093 | 1.064 | 1.079 | 1.080 | 1.091 | 1.164 | 1.144 | 1.113 |
| 2003 | 1.172 | 1.320 | 1.354 | 1.245 | 1.129 | 1.138 | 1.181 | 1.281 | 1.277 | 1.194 | 1.164 | 1.168 |
| 2004 | 1.278 | 1.333 | 1.399 | 1.454 | 1.623 | 1.631 | 1.583 | 1.565 | 1.553 | 1.668 | 1.657 | 1.529 |
| 2005 | 1.513 | 1.579 | 1.729 | 1.929 | 1.824 | 1.822 | 1.945 | 2.179 | 2.671 | 2.511 | 2.002 | 1.855 |
| 2006 | 2.030 | 1.954 | 2.108 | 2.465 | 2.499 | 2.478 | 2.600 | 2.589 | 2.153 | 1.871 | 1.889 | 1.985 |
| 2007 | 1.879 | 1.907 | 2.200 | 2.538 | 2.755 | 2.694 | 2.624 | 2.454 | 2.491 | 2.516 | 2.768 | 2.704 |
| 2008 | 2.767 | 2.764 | 2.964 | 3.152 | 3.497 | 3.701 | 3.741 | 3.453 | 3.542 | 2.935 | 1.875 | 1.401 |
| 2009 | 1.500 | 1.603 | 1.644 | 1.734 | 1.979 | 2.316 | 2.202 | 2.277 | 2.171 | 2.215 | 2.346 | 2.320 |
| 2010 | 2.438 | 2.387 | 2.492 | 2.534 | 2.539 | 2.374 | 2.355 | 2.389 | 2.363 | 2.471 | 2.537 | 2.689 |
| 2011 | 2.798 | 2.899 | - | - | - | - | - | - | - | - | - | - |
| 2012 | - | - | - | - | - | - | - | - | - | - | - | - |
| 2013 | - | - | - | - | - | - | - | - | - | - | - | - |
| 2014 | - | - | - | - | - | - | - | - | - | - | - | - |
| 2015 | - | - | - | - | - | - | - | - | - | - | - | - |
| 2016 | - | - | - | - | - | - | - | - | - | - | - | - |
| 2017 | - | - | - | - | - | - | - | - | - | - | - | - |
| 2018 | - | - | - | - | - | - | - | - | - | - | - | - |
| 2019 | - | - | - | - | - | - | - | - | - | - | - | - |
| 2020 | - | - | - | - | - | - | - | - | - | - | - | - |
| 2021 | - | - | - | - | - | - | - | - | - | - | - | - |
| 2022 | - | - | - | |||||||||
| - = No Data Reported; -- = Not Applicable; NA = Not Available; W = Withheld to avoid disclosure of individual company data. |
| Release Date: 6/1/2022 |
| Next Release Date: TBD |