|
Download Data (XLS File) |
|
||||||||
|
||||||||
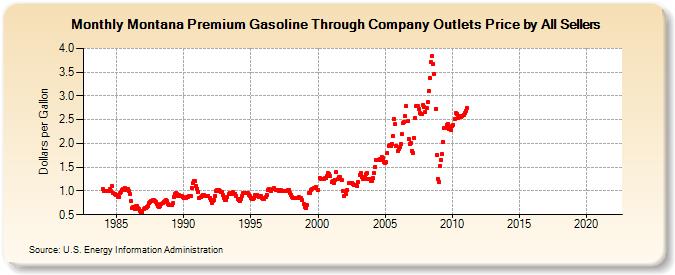
| Montana Premium Gasoline Through Company Outlets Price by All Sellers (Dollars per Gallon) | ||||||||
| Year | Jan | Feb | Mar | Apr | May | Jun | Jul | Aug | Sep | Oct | Nov | Dec |
|---|---|---|---|---|---|---|---|---|---|---|---|---|
| 1983 | W | W | W | W | W | W | W | W | W | W | W | W |
| 1984 | 1.031 | 1.009 | 1.002 | 0.990 | 0.992 | 1.004 | 1.037 | 0.995 | 1.098 | 0.951 | 0.935 | 0.922 |
| 1985 | 0.906 | 0.870 | 0.880 | 0.961 | 0.988 | 1.019 | 1.041 | 1.072 | 1.026 | 1.031 | 1.031 | 1.003 |
| 1986 | 0.929 | 0.780 | 0.644 | 0.658 | 0.628 | 0.676 | 0.692 | 0.633 | 0.615 | 0.586 | 0.543 | 0.555 |
| 1987 | 0.611 | 0.641 | 0.648 | 0.665 | 0.677 | 0.737 | 0.774 | 0.790 | 0.808 | 0.803 | 0.790 | 0.774 |
| 1988 | 0.729 | 0.689 | 0.660 | 0.691 | 0.724 | 0.744 | 0.766 | 0.796 | 0.801 | 0.782 | 0.734 | 0.705 |
| 1989 | 0.699 | 0.702 | 0.736 | 0.874 | 0.936 | 0.955 | 0.931 | 0.899 | 0.912 | 0.895 | 0.887 | 0.867 |
| 1990 | 0.853 | 0.853 | 0.854 | 0.864 | 0.880 | 0.887 | 0.896 | 1.068 | 1.165 | 1.217 | 1.202 | 1.112 |
| 1991 | 1.042 | 0.986 | 0.861 | 0.864 | 0.892 | 0.911 | 0.907 | 0.904 | 0.902 | 0.894 | 0.896 | 0.862 |
| 1992 | 0.803 | 0.755 | 0.780 | 0.818 | 0.900 | 0.991 | 1.024 | 1.019 | 0.998 | 0.987 | 0.975 | 0.919 |
| 1993 | 0.860 | 0.818 | 0.818 | 0.870 | 0.932 | 0.947 | 0.944 | 0.947 | 0.970 | 0.943 | 0.943 | 0.895 |
| 1994 | 0.828 | 0.802 | 0.795 | 0.834 | 0.904 | 0.948 | 0.962 | 0.953 | 0.967 | 0.948 | 0.924 | 0.900 |
| 1995 | 0.846 | 0.841 | 0.822 | 0.847 | 0.918 | 0.911 | 0.885 | 0.875 | 0.892 | 0.888 | 0.856 | 0.837 |
| 1996 | 0.838 | 0.868 | 0.925 | 1.020 | 1.039 | 1.023 | 1.006 | NA | 1.051 | 1.055 | 1.028 | 1.010 |
| 1997 | 1.012 | 1.003 | 1.017 | 1.013 | 1.005 | 0.995 | 0.992 | 1.002 | 1.009 | 1.023 | 1.011 | 0.959 |
| 1998 | 0.923 | 0.873 | 0.846 | 0.859 | 0.857 | 0.848 | 0.853 | 0.865 | 0.862 | 0.843 | 0.800 | 0.719 |
| 1999 | 0.661 | 0.645 | 0.703 | NA | 0.958 | 0.959 | 1.022 | 1.044 | 1.056 | 1.060 | 1.088 | NA |
| 2000 | 1.021 | NA | 1.271 | 1.256 | 1.257 | 1.261 | 1.263 | 1.265 | 1.309 | 1.377 | 1.362 | 1.306 |
| 2001 | 1.193 | 1.201 | 1.171 | 1.234 | 1.390 | NA | 1.247 | 1.287 | 1.284 | 1.222 | 1.001 | 0.901 |
| 2002 | NA | 0.934 | 1.028 | NA | 1.160 | 1.160 | 1.171 | 1.144 | 1.131 | 1.122 | 1.132 | 1.094 |
| 2003 | 1.190 | 1.331 | 1.378 | 1.290 | 1.251 | 1.243 | 1.301 | 1.357 | 1.372 | 1.262 | 1.247 | 1.203 |
| 2004 | 1.217 | 1.268 | 1.378 | 1.506 | 1.650 | 1.652 | 1.657 | 1.668 | 1.642 | 1.704 | 1.697 | 1.602 |
| 2005 | 1.593 | 1.609 | 1.798 | 1.954 | 1.967 | 1.936 | 1.996 | 2.146 | 2.509 | 2.402 | 1.952 | 1.836 |
| 2006 | 1.888 | 1.925 | 1.985 | 2.192 | 2.424 | 2.454 | 2.568 | 2.786 | 2.465 | 2.098 | 1.992 | 2.019 |
| 2007 | 1.847 | 1.809 | 2.118 | 2.532 | 2.794 | 2.793 | 2.719 | 2.644 | 2.609 | 2.617 | 2.818 | 2.766 |
| 2008 | 2.669 | 2.748 | 2.876 | 3.110 | 3.379 | 3.704 | 3.836 | 3.674 | 3.464 | 2.730 | 1.759 | 1.256 |
| 2009 | 1.195 | 1.531 | 1.658 | 1.769 | 2.030 | 2.327 | 2.335 | 2.393 | 2.411 | 2.305 | 2.334 | 2.273 |
| 2010 | 2.361 | 2.396 | 2.505 | 2.640 | 2.621 | 2.538 | 2.553 | 2.575 | 2.565 | 2.569 | 2.606 | 2.649 |
| 2011 | 2.685 | 2.750 | - | - | - | - | - | - | - | - | - | - |
| 2012 | - | - | - | - | - | - | - | - | - | - | - | - |
| 2013 | - | - | - | - | - | - | - | - | - | - | - | - |
| 2014 | - | - | - | - | - | - | - | - | - | - | - | - |
| 2015 | - | - | - | - | - | - | - | - | - | - | - | - |
| 2016 | - | - | - | - | - | - | - | - | - | - | - | - |
| 2017 | - | - | - | - | - | - | - | - | - | - | - | - |
| 2018 | - | - | - | - | - | - | - | - | - | - | - | - |
| 2019 | - | - | - | - | - | - | - | - | - | - | - | - |
| 2020 | - | - | - | - | - | - | - | - | - | - | - | - |
| 2021 | - | - | - | - | - | - | - | - | - | - | - | - |
| 2022 | - | - | - | |||||||||
| - = No Data Reported; -- = Not Applicable; NA = Not Available; W = Withheld to avoid disclosure of individual company data. |
| Release Date: 6/1/2022 |
| Next Release Date: TBD |