|
Download Data (XLS File) |
|
||||||||
|
||||||||
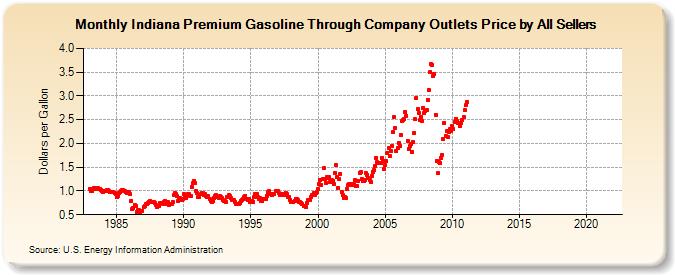
| Indiana Premium Gasoline Through Company Outlets Price by All Sellers (Dollars per Gallon) | ||||||||
| Year | Jan | Feb | Mar | Apr | May | Jun | Jul | Aug | Sep | Oct | Nov | Dec |
|---|---|---|---|---|---|---|---|---|---|---|---|---|
| 1983 | 1.050 | 1.009 | 0.990 | 1.036 | 1.053 | 1.050 | 1.068 | 1.067 | 1.047 | 1.046 | 1.026 | 0.990 |
| 1984 | 0.984 | 0.994 | 1.006 | 1.020 | 1.018 | 1.001 | 0.980 | 0.971 | 0.976 | 0.970 | 0.958 | 0.935 |
| 1985 | 0.866 | 0.893 | 0.952 | 0.968 | 0.998 | 1.016 | 1.011 | 0.991 | 0.980 | 0.966 | 0.987 | 0.986 |
| 1986 | 0.929 | 0.793 | 0.626 | 0.634 | 0.702 | 0.687 | 0.566 | 0.594 | 0.589 | 0.560 | 0.578 | 0.588 |
| 1987 | 0.652 | 0.686 | 0.716 | 0.730 | 0.753 | 0.774 | 0.792 | 0.774 | 0.768 | 0.764 | 0.757 | 0.706 |
| 1988 | 0.661 | 0.673 | 0.673 | 0.748 | 0.757 | 0.734 | 0.772 | 0.792 | 0.748 | 0.720 | 0.761 | 0.709 |
| 1989 | 0.730 | 0.733 | 0.777 | 0.924 | 0.960 | 0.931 | 0.884 | 0.797 | 0.836 | 0.844 | 0.815 | 0.829 |
| 1990 | 0.935 | 0.868 | 0.855 | 0.901 | 0.934 | 0.926 | 0.899 | 1.092 | 1.162 | 1.213 | 1.163 | 1.004 |
| 1991 | 0.954 | 0.875 | 0.874 | 0.930 | 0.957 | 0.950 | 0.919 | 0.928 | 0.884 | 0.865 | 0.886 | 0.841 |
| 1992 | 0.779 | 0.773 | 0.781 | 0.844 | 0.897 | 0.908 | 0.874 | 0.861 | 0.885 | 0.878 | 0.849 | 0.817 |
| 1993 | 0.792 | 0.779 | 0.766 | 0.864 | 0.909 | 0.888 | 0.842 | 0.818 | 0.813 | 0.803 | 0.769 | 0.718 |
| 1994 | 0.734 | 0.718 | 0.750 | 0.791 | 0.805 | 0.828 | 0.866 | 0.902 | 0.833 | 0.806 | 0.828 | 0.774 |
| 1995 | 0.791 | 0.795 | 0.774 | 0.877 | 0.945 | 0.937 | 0.863 | 0.836 | 0.844 | 0.799 | 0.788 | 0.834 |
| 1996 | 0.827 | 0.838 | 0.902 | 0.972 | 0.992 | 0.938 | 0.927 | 0.911 | 0.930 | 0.946 | 1.001 | 0.999 |
| 1997 | 0.990 | 0.953 | 0.921 | 0.916 | 0.944 | 0.933 | 0.911 | 0.967 | 0.928 | 0.879 | 0.866 | 0.817 |
| 1998 | 0.769 | 0.766 | 0.759 | 0.797 | 0.840 | 0.821 | 0.806 | 0.768 | 0.769 | 0.757 | 0.727 | 0.688 |
| 1999 | 0.675 | 0.656 | 0.755 | 0.801 | 0.813 | 0.816 | 0.873 | 0.919 | 0.952 | 0.920 | 0.959 | 0.974 |
| 2000 | 1.041 | 1.145 | 1.223 | 1.127 | 1.249 | 1.476 | 1.251 | 1.171 | 1.293 | 1.269 | 1.284 | 1.181 |
| 2001 | 1.230 | 1.206 | 1.153 | 1.382 | 1.555 | 1.288 | 1.069 | 1.242 | 1.362 | 0.976 | 0.910 | 0.861 |
| 2002 | 0.878 | 0.856 | 1.038 | 1.135 | 1.147 | 1.122 | 1.144 | 1.131 | 1.143 | 1.220 | 1.100 | 1.101 |
| 2003 | 1.213 | 1.385 | 1.397 | 1.252 | 1.201 | 1.215 | 1.238 | 1.368 | 1.346 | 1.268 | 1.220 | 1.194 |
| 2004 | 1.322 | 1.400 | 1.438 | 1.520 | 1.694 | 1.599 | 1.587 | 1.578 | 1.581 | 1.701 | 1.624 | 1.464 |
| 2005 | 1.543 | 1.622 | 1.802 | 1.902 | 1.739 | 1.832 | 1.948 | 2.237 | 2.561 | 2.335 | 1.851 | 1.900 |
| 2006 | 2.013 | 1.946 | 2.167 | 2.465 | 2.494 | 2.520 | 2.671 | 2.585 | 2.058 | 1.878 | 1.941 | 1.980 |
| 2007 | 1.828 | 2.022 | 2.217 | 2.504 | 2.957 | 2.720 | 2.644 | 2.496 | 2.566 | 2.474 | 2.749 | 2.636 |
| 2008 | 2.685 | 2.705 | 2.921 | 3.117 | 3.501 | 3.667 | 3.660 | 3.429 | 3.464 | 2.604 | 1.635 | 1.372 |
| 2009 | 1.607 | 1.596 | 1.687 | 1.760 | 2.092 | 2.439 | 2.159 | 2.253 | 2.136 | 2.250 | 2.301 | 2.255 |
| 2010 | 2.366 | 2.308 | 2.447 | 2.521 | 2.478 | 2.428 | 2.438 | 2.365 | 2.430 | 2.495 | 2.556 | 2.700 |
| 2011 | 2.806 | 2.879 | - | - | - | - | - | - | - | - | - | - |
| 2012 | - | - | - | - | - | - | - | - | - | - | - | - |
| 2013 | - | - | - | - | - | - | - | - | - | - | - | - |
| 2014 | - | - | - | - | - | - | - | - | - | - | - | - |
| 2015 | - | - | - | - | - | - | - | - | - | - | - | - |
| 2016 | - | - | - | - | - | - | - | - | - | - | - | - |
| 2017 | - | - | - | - | - | - | - | - | - | - | - | - |
| 2018 | - | - | - | - | - | - | - | - | - | - | - | - |
| 2019 | - | - | - | - | - | - | - | - | - | - | - | - |
| 2020 | - | - | - | - | - | - | - | - | - | - | - | - |
| 2021 | - | - | - | - | - | - | - | - | - | - | - | - |
| 2022 | - | - | - | |||||||||
| - = No Data Reported; -- = Not Applicable; NA = Not Available; W = Withheld to avoid disclosure of individual company data. |
| Release Date: 6/1/2022 |
| Next Release Date: TBD |