|
Download Data (XLS File) |
|
||||||||
|
||||||||
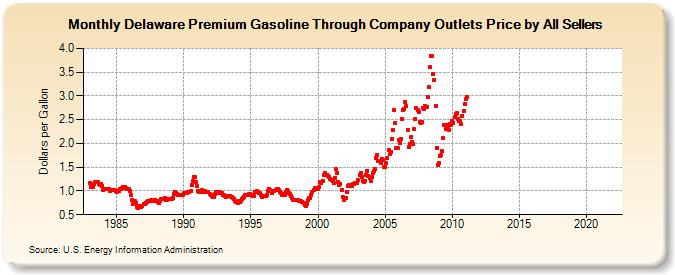
| Delaware Premium Gasoline Through Company Outlets Price by All Sellers (Dollars per Gallon) | ||||||||
| Year | Jan | Feb | Mar | Apr | May | Jun | Jul | Aug | Sep | Oct | Nov | Dec |
|---|---|---|---|---|---|---|---|---|---|---|---|---|
| 1983 | 1.165 | 1.085 | 1.130 | 1.093 | 1.142 | 1.186 | 1.184 | 1.193 | 1.155 | 1.130 | 1.144 | 1.111 |
| 1984 | 1.018 | 1.051 | 1.035 | 1.039 | 1.041 | 1.034 | 0.999 | 1.023 | 1.023 | 1.024 | 1.019 | 1.001 |
| 1985 | 0.974 | 0.989 | 0.998 | 1.034 | 1.048 | 1.056 | 1.074 | 1.076 | 1.057 | 1.045 | 1.043 | 1.036 |
| 1986 | 1.004 | 0.916 | 0.802 | 0.732 | 0.785 | 0.747 | 0.667 | 0.651 | 0.675 | 0.654 | 0.660 | 0.686 |
| 1987 | 0.735 | 0.727 | 0.752 | 0.758 | 0.781 | 0.796 | 0.797 | 0.804 | 0.798 | 0.801 | 0.808 | 0.787 |
| 1988 | 0.779 | 0.760 | 0.755 | 0.790 | 0.823 | 0.825 | 0.841 | 0.845 | 0.808 | 0.816 | 0.826 | 0.832 |
| 1989 | 0.831 | 0.828 | 0.853 | 0.934 | 0.978 | 0.950 | 0.942 | 0.918 | 0.924 | 0.918 | 0.908 | 0.923 |
| 1990 | 0.959 | 0.949 | 0.949 | 0.958 | 0.971 | 0.980 | 0.996 | 1.115 | 1.211 | 1.303 | 1.287 | 1.178 |
| 1991 | 1.102 | 1.007 | 0.984 | 1.009 | 1.012 | 0.985 | 0.979 | 1.004 | 0.983 | 0.968 | 0.969 | 0.944 |
| 1992 | 0.905 | 0.892 | 0.877 | 0.883 | 0.933 | 0.977 | 0.969 | 0.967 | 0.974 | 0.964 | 0.960 | 0.923 |
| 1993 | 0.905 | 0.889 | 0.883 | 0.888 | 0.892 | 0.885 | 0.870 | 0.864 | 0.842 | 0.833 | 0.793 | 0.773 |
| 1994 | 0.740 | 0.788 | 0.773 | 0.786 | 0.830 | 0.858 | 0.881 | 0.916 | 0.916 | 0.913 | 0.929 | 0.935 |
| 1995 | 0.920 | 0.910 | 0.899 | 0.902 | 0.973 | 0.994 | 0.978 | 0.952 | 0.947 | 0.913 | 0.883 | 0.886 |
| 1996 | 0.892 | 0.888 | 0.907 | 0.999 | 1.046 | 1.022 | 0.990 | 0.953 | 0.998 | 0.993 | 1.016 | 1.038 |
| 1997 | 1.031 | 1.013 | 0.986 | 0.958 | 0.914 | 0.932 | 0.915 | 0.984 | 1.010 | 0.989 | 0.963 | 0.929 |
| 1998 | 0.901 | 0.850 | 0.808 | 0.801 | 0.814 | 0.816 | 0.802 | 0.788 | 0.779 | 0.783 | 0.776 | 0.736 |
| 1999 | 0.710 | 0.690 | 0.724 | 0.820 | 0.862 | 0.848 | 0.906 | 0.981 | 1.020 | 1.053 | 1.041 | 1.045 |
| 2000 | 1.049 | 1.084 | 1.197 | 1.158 | 1.205 | 1.330 | 1.368 | 1.340 | 1.339 | 1.309 | 1.303 | 1.242 |
| 2001 | 1.222 | 1.214 | 1.171 | 1.279 | 1.459 | 1.388 | 1.190 | 1.129 | 1.154 | 1.021 | 0.866 | 0.804 |
| 2002 | 0.843 | 0.858 | 0.972 | 1.112 | 1.126 | 1.097 | 1.100 | 1.143 | 1.146 | 1.167 | 1.170 | 1.163 |
| 2003 | 1.220 | 1.335 | 1.374 | 1.298 | 1.216 | 1.198 | 1.218 | 1.330 | 1.428 | 1.321 | 1.267 | 1.208 |
| 2004 | 1.296 | 1.376 | 1.425 | 1.464 | 1.688 | 1.753 | 1.639 | 1.630 | 1.594 | 1.674 | 1.641 | 1.501 |
| 2005 | 1.502 | 1.579 | 1.687 | 1.871 | 1.775 | 1.828 | 2.085 | 2.278 | 2.701 | 2.436 | 1.911 | 1.898 |
| 2006 | 2.082 | 2.004 | 2.100 | 2.519 | 2.704 | 2.724 | 2.863 | 2.786 | 2.287 | 1.934 | 1.993 | 2.135 |
| 2007 | 2.030 | 1.984 | 2.294 | 2.519 | 2.752 | 2.707 | 2.652 | 2.455 | 2.427 | 2.453 | 2.755 | 2.731 |
| 2008 | 2.784 | 2.771 | 2.986 | 3.198 | 3.601 | 3.846 | 3.830 | 3.470 | 3.333 | 2.798 | 1.908 | 1.539 |
| 2009 | 1.578 | 1.744 | 1.749 | 1.843 | 2.107 | 2.386 | 2.305 | 2.391 | 2.342 | 2.293 | 2.419 | 2.396 |
| 2010 | 2.477 | 2.436 | 2.557 | 2.609 | 2.646 | 2.519 | 2.472 | 2.478 | 2.401 | 2.583 | 2.680 | 2.827 |
| 2011 | 2.928 | 2.971 | - | - | - | - | - | - | - | - | - | - |
| 2012 | - | - | - | - | - | - | - | - | - | - | - | - |
| 2013 | - | - | - | - | - | - | - | - | - | - | - | - |
| 2014 | - | - | - | - | - | - | - | - | - | - | - | - |
| 2015 | - | - | - | - | - | - | - | - | - | - | - | - |
| 2016 | - | - | - | - | - | - | - | - | - | - | - | - |
| 2017 | - | - | - | - | - | - | - | - | - | - | - | - |
| 2018 | - | - | - | - | - | - | - | - | - | - | - | - |
| 2019 | - | - | - | - | - | - | - | - | - | - | - | - |
| 2020 | - | - | - | - | - | - | - | - | - | - | - | - |
| 2021 | - | - | - | - | - | - | - | - | - | - | - | - |
| 2022 | - | - | - | |||||||||
| - = No Data Reported; -- = Not Applicable; NA = Not Available; W = Withheld to avoid disclosure of individual company data. |
| Release Date: 6/1/2022 |
| Next Release Date: TBD |