|
Download Data (XLS File) |
|
||||||||
|
||||||||
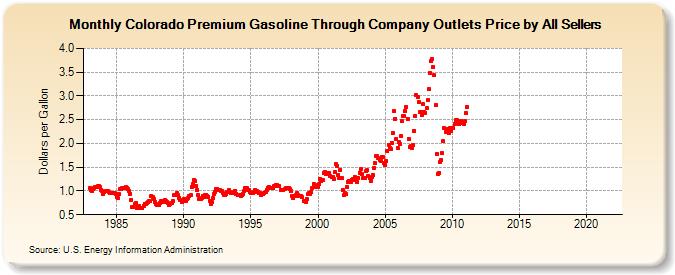
| Colorado Premium Gasoline Through Company Outlets Price by All Sellers (Dollars per Gallon) | ||||||||
| Year | Jan | Feb | Mar | Apr | May | Jun | Jul | Aug | Sep | Oct | Nov | Dec |
|---|---|---|---|---|---|---|---|---|---|---|---|---|
| 1983 | 1.052 | 1.012 | 0.999 | 1.031 | 1.071 | 1.086 | 1.076 | 1.094 | 1.101 | 1.074 | 1.029 | 1.006 |
| 1984 | 0.936 | 0.969 | 0.998 | 1.007 | 1.005 | 0.983 | 0.964 | 0.956 | 0.958 | 0.966 | 0.963 | 0.927 |
| 1985 | 0.864 | 0.849 | 0.932 | 1.031 | 1.038 | 1.055 | 1.069 | 1.068 | 1.074 | 1.072 | 1.041 | 1.005 |
| 1986 | 0.942 | 0.819 | 0.665 | 0.670 | 0.715 | 0.746 | 0.650 | 0.674 | 0.686 | 0.640 | 0.651 | 0.649 |
| 1987 | 0.690 | 0.734 | 0.724 | 0.748 | 0.760 | 0.781 | 0.790 | 0.903 | 0.870 | 0.822 | 0.777 | 0.726 |
| 1988 | 0.710 | 0.697 | 0.695 | 0.736 | 0.780 | 0.768 | 0.785 | 0.807 | 0.780 | 0.771 | 0.736 | 0.702 |
| 1989 | 0.721 | 0.749 | 0.782 | 0.905 | 0.919 | 0.914 | 0.954 | 0.909 | 0.854 | 0.809 | 0.774 | 0.781 |
| 1990 | 0.826 | 0.804 | 0.796 | 0.825 | 0.855 | 0.901 | 0.905 | 1.085 | 1.142 | 1.226 | 1.205 | 1.113 |
| 1991 | 1.018 | 0.906 | 0.829 | 0.831 | 0.857 | 0.894 | 0.883 | 0.913 | 0.925 | 0.892 | 0.883 | 0.792 |
| 1992 | 0.726 | 0.765 | 0.844 | 0.934 | 0.983 | 1.047 | 1.041 | 1.024 | 1.028 | 0.995 | 1.002 | 0.950 |
| 1993 | 0.924 | 0.925 | 0.933 | 0.980 | 1.010 | 0.977 | 0.962 | 0.963 | 0.954 | 0.984 | 1.003 | 0.945 |
| 1994 | 0.910 | 0.922 | 0.907 | 0.904 | 0.906 | 0.943 | 0.996 | 1.069 | 1.070 | 1.016 | 1.019 | 0.987 |
| 1995 | 0.963 | 0.948 | 0.953 | 0.983 | 1.030 | 0.996 | 0.976 | 0.957 | 0.966 | 0.912 | 0.926 | 0.935 |
| 1996 | 0.967 | 0.973 | 1.020 | 1.071 | 1.089 | 1.069 | 1.057 | 1.058 | 1.067 | 1.095 | 1.129 | 1.117 |
| 1997 | 1.107 | 1.100 | NA | 1.029 | 1.025 | 1.026 | 1.033 | 1.058 | 1.056 | 1.052 | 1.054 | 1.037 |
| 1998 | 1.002 | 0.903 | 0.843 | 0.888 | 0.912 | 0.947 | 0.912 | 0.894 | 0.887 | 0.904 | 0.867 | 0.781 |
| 1999 | 0.782 | 0.770 | 0.826 | 0.927 | 0.961 | 0.938 | 0.969 | 1.057 | 1.147 | 1.123 | 1.091 | 1.099 |
| 2000 | 1.088 | 1.141 | 1.254 | 1.207 | 1.230 | 1.379 | 1.405 | 1.360 | 1.383 | 1.388 | 1.375 | 1.307 |
| 2001 | 1.286 | 1.299 | 1.252 | 1.398 | 1.569 | 1.527 | 1.331 | 1.273 | 1.451 | 1.270 | 1.025 | 0.907 |
| 2002 | 0.949 | 0.941 | 1.081 | 1.191 | 1.211 | 1.180 | 1.240 | 1.254 | 1.220 | 1.297 | 1.267 | 1.192 |
| 2003 | 1.278 | 1.384 | 1.453 | 1.350 | 1.267 | 1.271 | 1.280 | 1.414 | 1.435 | 1.318 | 1.274 | 1.218 |
| 2004 | 1.298 | 1.345 | 1.488 | 1.582 | 1.732 | 1.727 | 1.690 | 1.651 | 1.639 | 1.720 | 1.704 | 1.584 |
| 2005 | 1.547 | 1.629 | 1.844 | 1.976 | 1.904 | 1.873 | 2.016 | 2.223 | 2.686 | 2.522 | 2.088 | 1.904 |
| 2006 | 2.023 | 1.981 | 2.150 | 2.463 | 2.569 | 2.580 | 2.685 | 2.764 | 2.524 | 2.096 | 1.927 | 1.936 |
| 2007 | 1.897 | 1.958 | 2.270 | 2.575 | 3.019 | 2.982 | 2.872 | 2.668 | 2.656 | 2.592 | 2.822 | 2.655 |
| 2008 | 2.649 | 2.737 | 2.908 | 3.139 | 3.484 | 3.729 | 3.787 | 3.599 | 3.432 | 2.811 | 1.782 | 1.359 |
| 2009 | 1.388 | 1.610 | 1.654 | 1.797 | 2.041 | 2.318 | 2.248 | 2.311 | 2.231 | 2.224 | 2.323 | 2.253 |
| 2010 | 2.330 | 2.324 | 2.413 | 2.486 | 2.486 | 2.423 | 2.418 | 2.450 | 2.480 | 2.435 | 2.416 | 2.472 |
| 2011 | 2.638 | 2.769 | - | - | - | - | - | - | - | - | - | - |
| 2012 | - | - | - | - | - | - | - | - | - | - | - | - |
| 2013 | - | - | - | - | - | - | - | - | - | - | - | - |
| 2014 | - | - | - | - | - | - | - | - | - | - | - | - |
| 2015 | - | - | - | - | - | - | - | - | - | - | - | - |
| 2016 | - | - | - | - | - | - | - | - | - | - | - | - |
| 2017 | - | - | - | - | - | - | - | - | - | - | - | - |
| 2018 | - | - | - | - | - | - | - | - | - | - | - | - |
| 2019 | - | - | - | - | - | - | - | - | - | - | - | - |
| 2020 | - | - | - | - | - | - | - | - | - | - | - | - |
| 2021 | - | - | - | - | - | - | - | - | - | - | - | - |
| 2022 | - | - | - | |||||||||
| - = No Data Reported; -- = Not Applicable; NA = Not Available; W = Withheld to avoid disclosure of individual company data. |
| Release Date: 6/1/2022 |
| Next Release Date: TBD |