|
Download Data (XLS File) |
|
||||||||
|
||||||||
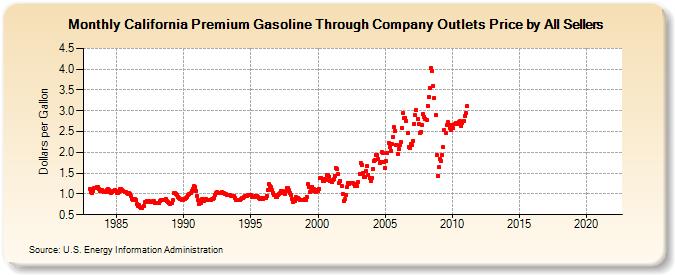
| California Premium Gasoline Through Company Outlets Price by All Sellers (Dollars per Gallon) | ||||||||
| Year | Jan | Feb | Mar | Apr | May | Jun | Jul | Aug | Sep | Oct | Nov | Dec |
|---|---|---|---|---|---|---|---|---|---|---|---|---|
| 1983 | 1.126 | 1.049 | 1.030 | 1.068 | 1.138 | 1.148 | 1.171 | 1.167 | 1.117 | 1.062 | 1.072 | 1.100 |
| 1984 | 1.059 | 1.039 | 1.055 | 1.096 | 1.110 | 1.093 | 1.040 | 1.031 | 1.058 | 1.078 | 1.085 | 1.059 |
| 1985 | 1.030 | 1.016 | 1.053 | 1.111 | 1.112 | 1.102 | 1.075 | 1.043 | 1.042 | 1.027 | 1.010 | 1.018 |
| 1986 | 1.000 | 0.942 | 0.866 | 0.846 | 0.870 | 0.849 | 0.765 | 0.717 | 0.726 | 0.677 | 0.661 | 0.672 |
| 1987 | 0.715 | 0.800 | 0.815 | 0.822 | 0.830 | 0.821 | 0.808 | 0.815 | 0.819 | 0.821 | 0.793 | 0.783 |
| 1988 | 0.786 | 0.771 | 0.773 | 0.828 | 0.846 | 0.854 | 0.861 | 0.863 | 0.869 | 0.841 | 0.801 | 0.782 |
| 1989 | 0.759 | 0.774 | 0.843 | 1.013 | 1.024 | 1.010 | 0.976 | 0.927 | 0.892 | 0.884 | 0.858 | 0.847 |
| 1990 | 0.872 | 0.883 | 0.903 | 0.928 | 0.975 | 0.995 | 1.016 | 1.082 | 1.120 | 1.179 | 1.169 | 1.077 |
| 1991 | 0.948 | 0.844 | 0.752 | 0.789 | 0.871 | 0.872 | 0.835 | 0.860 | 0.872 | 0.858 | 0.855 | 0.843 |
| 1992 | 0.860 | 0.870 | 0.867 | 0.910 | 0.984 | 1.027 | 1.043 | 1.034 | 1.025 | 1.032 | 1.047 | 1.029 |
| 1993 | 1.014 | 1.008 | 0.988 | 0.969 | 0.967 | 0.969 | 0.958 | 0.941 | 0.944 | 0.951 | 0.907 | 0.863 |
| 1994 | 0.845 | 0.849 | 0.858 | 0.872 | 0.891 | 0.911 | 0.938 | 0.956 | 0.955 | 0.968 | 0.981 | 0.964 |
| 1995 | 0.963 | 0.933 | 0.916 | 0.930 | 0.960 | 0.959 | 0.937 | 0.903 | 0.879 | 0.902 | 0.899 | 0.885 |
| 1996 | 0.894 | 0.909 | 0.960 | 1.098 | 1.229 | 1.198 | 1.156 | 1.087 | 1.026 | 0.982 | 0.916 | 0.916 |
| 1997 | 0.968 | 1.006 | 1.023 | 1.065 | 1.059 | 1.015 | 0.991 | 1.062 | 1.145 | 1.136 | 1.087 | 1.033 |
| 1998 | 0.972 | 0.871 | 0.803 | 0.840 | 0.929 | 0.908 | 0.901 | 0.872 | 0.860 | 0.865 | 0.853 | 0.853 |
| 1999 | 0.869 | 0.851 | 0.934 | 1.232 | 1.167 | 1.042 | 1.078 | 1.176 | 1.118 | 1.062 | 1.057 | 1.083 |
| 2000 | 1.061 | 1.127 | 1.387 | 1.389 | 1.308 | 1.303 | 1.360 | 1.325 | 1.452 | 1.450 | 1.419 | 1.316 |
| 2001 | 1.288 | 1.326 | 1.349 | 1.439 | 1.630 | 1.611 | 1.469 | 1.267 | 1.314 | 1.182 | 1.001 | 0.825 |
| 2002 | 0.867 | 0.973 | 1.160 | 1.264 | 1.243 | 1.260 | 1.266 | 1.264 | 1.245 | 1.196 | 1.244 | 1.189 |
| 2003 | 1.291 | 1.479 | 1.748 | 1.699 | 1.496 | 1.418 | 1.401 | 1.557 | 1.669 | 1.456 | 1.374 | 1.312 |
| 2004 | 1.385 | 1.607 | 1.794 | 1.821 | 1.934 | 1.930 | 1.830 | 1.746 | 1.759 | 2.012 | 1.995 | 1.760 |
| 2005 | 1.633 | 1.784 | 1.985 | 2.232 | 2.130 | 2.041 | 2.194 | 2.372 | 2.598 | 2.509 | 2.185 | 1.960 |
| 2006 | 2.079 | 2.167 | 2.254 | 2.593 | 2.942 | 2.818 | 2.836 | 2.757 | 2.456 | 2.140 | 2.108 | 2.206 |
| 2007 | 2.173 | 2.283 | 2.683 | 2.892 | 3.010 | 2.809 | 2.687 | 2.477 | 2.496 | 2.662 | 2.921 | 2.851 |
| 2008 | 2.806 | 2.769 | 3.124 | 3.338 | 3.558 | 4.026 | 3.951 | 3.596 | 3.311 | 2.903 | 1.934 | 1.439 |
| 2009 | 1.641 | 1.847 | 1.799 | 1.940 | 2.124 | 2.533 | 2.454 | 2.649 | 2.723 | 2.646 | 2.583 | 2.544 |
| 2010 | 2.650 | 2.578 | 2.681 | 2.703 | 2.696 | 2.691 | 2.741 | 2.742 | 2.628 | 2.712 | 2.762 | 2.870 |
| 2011 | 2.942 | 3.104 | - | - | - | - | - | - | - | - | - | - |
| 2012 | - | - | - | - | - | - | - | - | - | - | - | - |
| 2013 | - | - | - | - | - | - | - | - | - | - | - | - |
| 2014 | - | - | - | - | - | - | - | - | - | - | - | - |
| 2015 | - | - | - | - | - | - | - | - | - | - | - | - |
| 2016 | - | - | - | - | - | - | - | - | - | - | - | - |
| 2017 | - | - | - | - | - | - | - | - | - | - | - | - |
| 2018 | - | - | - | - | - | - | - | - | - | - | - | - |
| 2019 | - | - | - | - | - | - | - | - | - | - | - | - |
| 2020 | - | - | - | - | - | - | - | - | - | - | - | - |
| 2021 | - | - | - | - | - | - | - | - | - | - | - | - |
| 2022 | - | - | - | |||||||||
| - = No Data Reported; -- = Not Applicable; NA = Not Available; W = Withheld to avoid disclosure of individual company data. |
| Release Date: 6/1/2022 |
| Next Release Date: TBD |