|
Download Data (XLS File) |
|
||||||||
|
||||||||
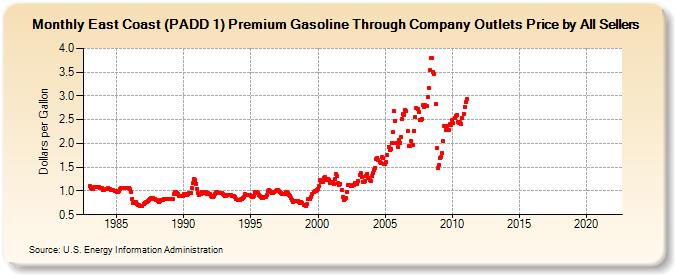
| East Coast (PADD 1) Premium Gasoline Through Company Outlets Price by All Sellers (Dollars per Gallon) | ||||||||
| Year | Jan | Feb | Mar | Apr | May | Jun | Jul | Aug | Sep | Oct | Nov | Dec |
|---|---|---|---|---|---|---|---|---|---|---|---|---|
| 1983 | 1.098 | 1.062 | 1.046 | 1.050 | 1.075 | 1.084 | 1.084 | 1.083 | 1.079 | 1.066 | 1.062 | 1.053 |
| 1984 | 1.017 | 1.030 | 1.033 | 1.041 | 1.054 | 1.049 | 1.033 | 1.014 | 1.017 | 1.016 | 1.009 | 0.997 |
| 1985 | 0.984 | 0.976 | 0.999 | 1.042 | 1.056 | 1.062 | 1.069 | 1.064 | 1.056 | 1.063 | 1.064 | 1.063 |
| 1986 | 1.034 | 0.971 | 0.828 | 0.740 | 0.769 | 0.774 | 0.719 | 0.696 | 0.697 | 0.678 | 0.680 | 0.687 |
| 1987 | 0.727 | 0.753 | 0.760 | 0.776 | 0.787 | 0.807 | 0.826 | 0.845 | 0.843 | 0.835 | 0.832 | 0.818 |
| 1988 | 0.802 | 0.785 | 0.774 | 0.790 | 0.808 | 0.810 | 0.831 | 0.838 | 0.833 | 0.827 | 0.827 | 0.821 |
| 1989 | 0.821 | 0.824 | 0.841 | 0.936 | 0.982 | 0.981 | 0.965 | 0.927 | 0.902 | 0.898 | 0.889 | 0.891 |
| 1990 | 0.943 | 0.930 | 0.916 | 0.924 | 0.940 | 0.956 | 0.957 | 1.069 | 1.161 | 1.243 | 1.240 | 1.156 |
| 1991 | 1.044 | 0.950 | 0.915 | 0.942 | 0.980 | 0.977 | 0.958 | 0.970 | 0.969 | 0.944 | 0.948 | 0.928 |
| 1992 | 0.901 | 0.879 | 0.868 | 0.887 | 0.931 | 0.968 | 0.969 | 0.961 | 0.956 | 0.951 | 0.953 | 0.934 |
| 1993 | 0.915 | 0.900 | 0.894 | 0.909 | 0.922 | 0.923 | 0.911 | 0.904 | 0.888 | 0.886 | 0.864 | 0.828 |
| 1994 | 0.805 | 0.811 | 0.810 | 0.822 | 0.834 | 0.855 | 0.882 | 0.926 | 0.923 | 0.913 | 0.922 | 0.906 |
| 1995 | 0.888 | 0.878 | 0.867 | 0.903 | 0.970 | 0.979 | 0.949 | 0.920 | 0.902 | 0.879 | 0.850 | 0.853 |
| 1996 | 0.869 | 0.869 | 0.908 | 0.990 | 1.029 | 1.008 | 0.986 | 0.962 | 0.960 | 0.972 | 1.004 | 1.019 |
| 1997 | 1.020 | 1.004 | 0.974 | 0.953 | 0.942 | 0.935 | 0.928 | 0.975 | 0.982 | 0.956 | 0.925 | 0.890 |
| 1998 | 0.851 | 0.809 | 0.778 | 0.787 | 0.799 | 0.799 | 0.787 | 0.767 | 0.754 | 0.767 | 0.751 | 0.708 |
| 1999 | 0.697 | 0.677 | 0.723 | 0.824 | 0.840 | 0.833 | 0.880 | 0.941 | 0.976 | 0.989 | 1.000 | 1.025 |
| 2000 | 1.035 | 1.103 | 1.227 | 1.178 | 1.198 | 1.276 | 1.291 | 1.231 | 1.261 | 1.248 | 1.231 | 1.175 |
| 2001 | 1.189 | 1.195 | 1.148 | 1.258 | 1.359 | 1.307 | 1.158 | 1.120 | 1.153 | 1.017 | 0.879 | 0.814 |
| 2002 | 0.840 | 0.843 | 0.974 | 1.132 | 1.123 | 1.101 | 1.107 | 1.120 | 1.126 | 1.176 | 1.165 | 1.146 |
| 2003 | 1.209 | 1.341 | 1.382 | 1.296 | 1.197 | 1.185 | 1.216 | 1.316 | 1.364 | 1.280 | 1.232 | 1.218 |
| 2004 | 1.318 | 1.379 | 1.444 | 1.492 | 1.669 | 1.701 | 1.642 | 1.607 | 1.590 | 1.709 | 1.693 | 1.575 |
| 2005 | 1.563 | 1.615 | 1.756 | 1.931 | 1.861 | 1.876 | 2.013 | 2.236 | 2.680 | 2.472 | 2.000 | 1.921 |
| 2006 | 2.080 | 2.013 | 2.129 | 2.508 | 2.612 | 2.605 | 2.713 | 2.686 | 2.266 | 1.948 | 1.948 | 2.052 |
| 2007 | 1.962 | 1.966 | 2.271 | 2.546 | 2.755 | 2.722 | 2.667 | 2.492 | 2.490 | 2.521 | 2.800 | 2.768 |
| 2008 | 2.808 | 2.797 | 2.987 | 3.174 | 3.535 | 3.789 | 3.797 | 3.499 | 3.464 | 2.835 | 1.898 | 1.481 |
| 2009 | 1.549 | 1.685 | 1.719 | 1.803 | 2.042 | 2.370 | 2.283 | 2.359 | 2.278 | 2.292 | 2.414 | 2.389 |
| 2010 | 2.486 | 2.423 | 2.525 | 2.587 | 2.597 | 2.454 | 2.435 | 2.442 | 2.404 | 2.532 | 2.621 | 2.770 |
| 2011 | 2.872 | 2.945 | - | - | - | - | - | - | - | - | - | - |
| 2012 | - | - | - | - | - | - | - | - | - | - | - | - |
| 2013 | - | - | - | - | - | - | - | - | - | - | - | - |
| 2014 | - | - | - | - | - | - | - | - | - | - | - | - |
| 2015 | - | - | - | - | - | - | - | - | - | - | - | - |
| 2016 | - | - | - | - | - | - | - | - | - | - | - | - |
| 2017 | - | - | - | - | - | - | - | - | - | - | - | - |
| 2018 | - | - | - | - | - | - | - | - | - | - | - | - |
| 2019 | - | - | - | - | - | - | - | - | - | - | - | - |
| 2020 | - | - | - | - | - | - | - | - | - | - | - | - |
| 2021 | - | - | - | - | - | - | - | - | - | - | - | - |
| 2022 | - | - | - | |||||||||
| - = No Data Reported; -- = Not Applicable; NA = Not Available; W = Withheld to avoid disclosure of individual company data. |
| Release Date: 6/1/2022 |
| Next Release Date: TBD |