|
Download Data (XLS File) |
|
||||||||
|
||||||||
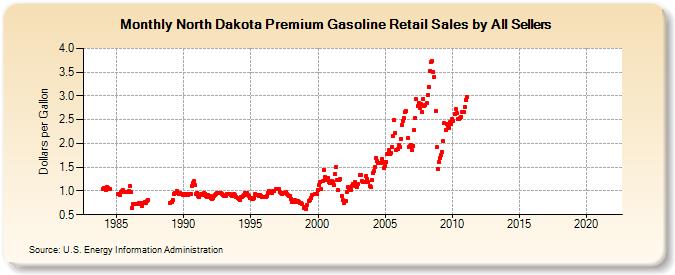
| North Dakota Premium Gasoline Retail Sales by All Sellers (Dollars per Gallon) | ||||||||
| Year | Jan | Feb | Mar | Apr | May | Jun | Jul | Aug | Sep | Oct | Nov | Dec |
|---|---|---|---|---|---|---|---|---|---|---|---|---|
| 1983 | W | W | W | W | W | W | W | W | W | W | W | W |
| 1984 | 1.041 | 1.059 | 1.026 | 1.086 | 1.056 | 1.039 | 1.038 | W | W | W | W | W |
| 1985 | W | 0.929 | 0.930 | 0.905 | 0.972 | 1.007 | 1.010 | 0.977 | 0.986 | 0.984 | 0.987 | 0.990 |
| 1986 | 1.100 | 0.975 | 0.648 | 0.719 | 0.729 | W | W | 0.734 | 0.749 | 0.735 | 0.747 | 0.685 |
| 1987 | 0.750 | 0.775 | 0.750 | 0.781 | 0.817 | |||||||
| 1988 | NA | NA | NA | NA | NA | NA | NA | NA | NA | NA | NA | NA |
| 1989 | 0.755 | 0.770 | 0.810 | 0.942 | 0.958 | 0.951 | 0.989 | 0.962 | 0.944 | 0.947 | 0.928 | 0.910 |
| 1990 | 0.940 | 0.937 | 0.920 | 0.938 | 0.923 | 0.944 | 0.943 | 1.105 | 1.175 | 1.203 | 1.119 | 0.940 |
| 1991 | 0.959 | 0.896 | 0.865 | 0.933 | 0.943 | 0.923 | 0.958 | 0.940 | 0.895 | 0.882 | 0.906 | 0.886 |
| 1992 | 0.843 | 0.826 | 0.853 | 0.894 | 0.909 | 0.931 | 0.961 | 0.955 | 0.954 | 0.948 | 0.936 | 0.917 |
| 1993 | 0.903 | 0.894 | 0.900 | 0.933 | 0.937 | 0.927 | 0.905 | 0.903 | 0.900 | 0.946 | 0.914 | 0.870 |
| 1994 | 0.842 | 0.840 | 0.819 | 0.866 | 0.871 | 0.888 | 0.910 | 0.964 | 0.959 | 0.921 | 0.893 | 0.850 |
| 1995 | 0.853 | 0.821 | 0.821 | 0.860 | 0.939 | 0.913 | 0.917 | 0.894 | 0.910 | 0.885 | 0.875 | 0.880 |
| 1996 | 0.870 | 0.873 | 0.898 | 0.965 | 0.990 | 0.969 | 0.963 | 0.961 | 0.999 | 0.992 | 1.034 | 1.051 |
| 1997 | 1.043 | 1.031 | 0.972 | 0.949 | 0.943 | 0.960 | 0.951 | 0.969 | 0.945 | 0.911 | 0.903 | 0.895 |
| 1998 | 0.828 | 0.776 | 0.771 | 0.809 | 0.773 | 0.792 | 0.795 | 0.777 | 0.755 | 0.751 | 0.720 | 0.651 |
| 1999 | 0.671 | 0.622 | 0.697 | NA | 0.796 | 0.806 | 0.862 | 0.912 | NA | 0.933 | 0.944 | 0.934 |
| 2000 | 1.011 | 1.122 | 1.182 | 1.032 | 1.204 | 1.449 | 1.285 | 1.235 | NA | 1.275 | 1.197 | 1.160 |
| 2001 | 1.215 | 1.187 | 1.116 | 1.352 | 1.504 | 1.226 | 1.021 | 1.223 | 1.256 | 0.899 | 0.806 | 0.746 |
| 2002 | 0.781 | 0.785 | 0.982 | 1.075 | 1.037 | 1.026 | 1.103 | 1.152 | 1.127 | 1.184 | 1.108 | 1.082 |
| 2003 | 1.144 | 1.331 | 1.344 | 1.214 | 1.195 | 1.197 | 1.198 | 1.313 | 1.259 | 1.196 | 1.100 | 1.087 |
| 2004 | 1.238 | 1.370 | 1.427 | 1.501 | 1.686 | 1.621 | 1.586 | 1.585 | 1.578 | 1.663 | 1.610 | 1.492 |
| 2005 | 1.532 | 1.613 | 1.776 | 1.855 | 1.786 | 1.805 | 1.930 | 2.163 | 2.495 | 2.222 | 1.868 | 1.880 |
| 2006 | 1.957 | 1.928 | 2.099 | 2.386 | 2.478 | 2.527 | 2.655 | 2.682 | 2.105 | 1.935 | 1.941 | 1.968 |
| 2007 | 1.854 | 1.955 | 2.283 | 2.532 | 2.925 | 2.784 | 2.859 | 2.748 | 2.823 | 2.663 | 2.935 | 2.794 |
| 2008 | 2.808 | 2.852 | 3.015 | 3.191 | 3.526 | 3.706 | 3.732 | 3.498 | 3.402 | 2.673 | 1.918 | 1.468 |
| 2009 | 1.601 | 1.689 | 1.752 | 1.828 | 2.045 | 2.422 | 2.292 | 2.412 | 2.363 | 2.325 | 2.443 | 2.407 |
| 2010 | 2.510 | 2.481 | 2.617 | 2.719 | 2.631 | 2.522 | 2.504 | 2.534 | 2.564 | 2.655 | 2.654 | 2.762 |
| 2011 | 2.920 | 2.985 | - | - | - | - | - | - | - | - | - | - |
| 2012 | - | - | - | - | - | - | - | - | - | - | - | - |
| 2013 | - | - | - | - | - | - | - | - | - | - | - | - |
| 2014 | - | - | - | - | - | - | - | - | - | - | - | - |
| 2015 | - | - | - | - | - | - | - | - | - | - | - | - |
| 2016 | - | - | - | - | - | - | - | - | - | - | - | - |
| 2017 | - | - | - | - | - | - | - | - | - | - | - | - |
| 2018 | - | - | - | - | - | - | - | - | - | - | - | - |
| 2019 | - | - | - | - | - | - | - | - | - | - | - | - |
| 2020 | - | - | - | - | - | - | - | - | - | - | - | - |
| 2021 | - | - | - | - | - | - | - | - | - | - | - | - |
| 2022 | - | - | - | |||||||||
| - = No Data Reported; -- = Not Applicable; NA = Not Available; W = Withheld to avoid disclosure of individual company data. |
| Release Date: 6/1/2022 |
| Next Release Date: TBD |