|
Download Data (XLS File) |
|
||||||||
|
||||||||
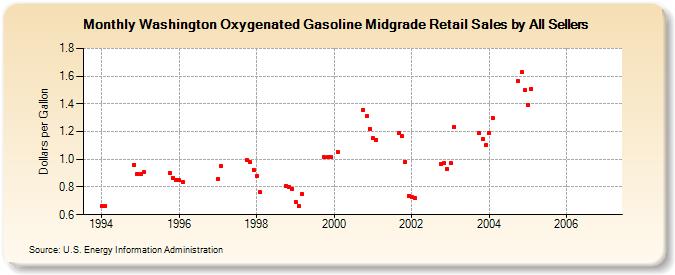
| Washington Oxygenated Gasoline Midgrade Retail Sales by All Sellers (Dollars per Gallon) | ||||||||
| Year | Jan | Feb | Mar | Apr | May | Jun | Jul | Aug | Sep | Oct | Nov | Dec |
|---|---|---|---|---|---|---|---|---|---|---|---|---|
| 1994 | 0.662 | 0.664 | - | - | - | - | - | - | - | W | 0.961 | 0.896 |
| 1995 | 0.895 | 0.905 | W | - | - | - | - | - | W | 0.900 | 0.864 | 0.852 |
| 1996 | 0.847 | 0.839 | NA | W | W | NA | NA | NA | NA | NA | NA | NA |
| 1997 | 0.860 | 0.948 | W | W | W | W | W | W | W | 0.998 | 0.977 | 0.926 |
| 1998 | 0.880 | 0.762 | W | W | W | W | W | W | W | 0.810 | 0.798 | 0.784 |
| 1999 | 0.692 | 0.661 | 0.752 | W | W | W | W | W | W | 1.014 | 1.013 | 1.017 |
| 2000 | W | 1.056 | W | W | W | W | W | W | W | 1.354 | 1.310 | 1.222 |
| 2001 | 1.151 | 1.141 | W | W | W | W | W | W | 1.189 | 1.166 | 0.983 | 0.734 |
| 2002 | 0.728 | 0.720 | W | W | W | W | W | W | W | 0.966 | 0.971 | 0.930 |
| 2003 | 0.970 | 1.235 | W | W | W | W | W | W | W | 1.187 | 1.146 | 1.101 |
| 2004 | 1.188 | 1.300 | W | W | W | W | W | W | NA | 1.562 | 1.628 | 1.497 |
| 2005 | 1.393 | 1.510 | - | - | - | - | - | - | - | - | - | - |
| 2006 | - | - | - | - | - | - | - | - | - | - | - | - |
| - = No Data Reported; -- = Not Applicable; NA = Not Available; W = Withheld to avoid disclosure of individual company data. |
| Release Date: 6/1/2022 |
| Next Release Date: TBD |