|
Download Data (XLS File) |
|
||||||||
|
||||||||
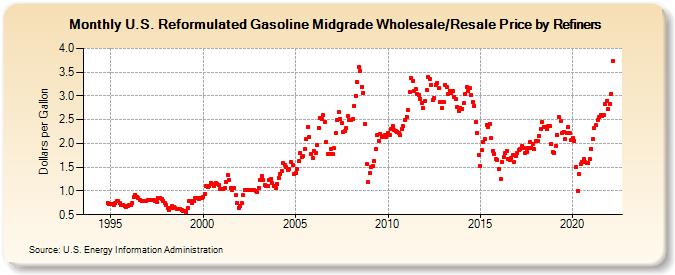
| U.S. Reformulated Gasoline Midgrade Wholesale/Resale Price by Refiners (Dollars per Gallon) | ||||||||
| Year | Jan | Feb | Mar | Apr | May | Jun | Jul | Aug | Sep | Oct | Nov | Dec |
|---|---|---|---|---|---|---|---|---|---|---|---|---|
| 1994 | - | - | - | - | - | - | - | - | - | - | 0.754 | 0.726 |
| 1995 | 0.732 | 0.724 | 0.709 | 0.740 | 0.793 | 0.786 | 0.742 | 0.711 | 0.702 | 0.683 | 0.669 | 0.683 |
| 1996 | 0.699 | 0.705 | 0.756 | 0.867 | 0.922 | 0.883 | 0.856 | 0.815 | 0.798 | 0.788 | 0.785 | 0.792 |
| 1997 | 0.814 | 0.810 | 0.810 | 0.815 | 0.806 | 0.780 | 0.764 | 0.845 | 0.862 | 0.829 | 0.794 | 0.755 |
| 1998 | 0.708 | 0.651 | 0.608 | 0.636 | 0.685 | 0.668 | 0.649 | 0.621 | 0.616 | 0.625 | 0.607 | 0.579 |
| 1999 | 0.579 | 0.562 | 0.646 | 0.798 | 0.780 | 0.741 | 0.792 | 0.858 | 0.859 | 0.841 | 0.846 | 0.861 |
| 2000 | 0.870 | 0.943 | 1.112 | 1.075 | 1.098 | 1.176 | 1.150 | 1.108 | 1.171 | 1.154 | 1.130 | 1.039 |
| 2001 | 1.033 | 1.049 | 1.054 | 1.195 | 1.334 | 1.237 | 1.072 | 1.022 | 1.055 | 0.905 | 0.755 | 0.647 |
| 2002 | 0.692 | 0.739 | 0.905 | 1.030 | 1.019 | 1.021 | 1.021 | 1.028 | 1.024 | 1.019 | 1.009 | 0.988 |
| 2003 | 1.069 | 1.222 | 1.323 | 1.229 | 1.118 | 1.107 | 1.103 | 1.238 | 1.262 | 1.159 | 1.099 | 1.063 |
| 2004 | 1.154 | 1.275 | 1.367 | 1.416 | 1.588 | 1.554 | 1.502 | 1.449 | 1.452 | 1.612 | 1.547 | 1.365 |
| 2005 | 1.371 | 1.456 | 1.632 | 1.799 | 1.708 | 1.728 | 1.873 | 2.087 | 2.355 | 2.137 | 1.769 | 1.686 |
| 2006 | 1.844 | 1.804 | 1.968 | 2.335 | 2.535 | 2.515 | 2.589 | 2.454 | 2.037 | 1.778 | 1.781 | 1.879 |
| 2007 | 1.783 | 1.894 | 2.224 | 2.484 | 2.660 | 2.515 | 2.431 | 2.233 | 2.259 | 2.324 | 2.572 | 2.502 |
| 2008 | 2.498 | 2.513 | 2.783 | 3.008 | 3.289 | 3.614 | 3.519 | 3.196 | 3.064 | 2.402 | 1.572 | 1.185 |
| 2009 | 1.371 | 1.502 | 1.525 | 1.625 | 1.878 | 2.171 | 2.048 | 2.200 | 2.137 | 2.151 | 2.169 | 2.141 |
| 2010 | 2.228 | 2.168 | 2.306 | 2.361 | 2.274 | 2.254 | 2.247 | 2.216 | 2.174 | 2.306 | 2.358 | 2.493 |
| 2011 | 2.566 | 2.705 | 3.087 | 3.381 | 3.316 | 3.113 | 3.147 | 3.030 | 3.028 | 2.936 | 2.847 | 2.744 |
| 2012 | 2.897 | 3.117 | 3.403 | 3.346 | 3.233 | 2.904 | 2.954 | 3.234 | 3.279 | 3.163 | 2.872 | 2.751 |
| 2013 | 2.867 | 3.238 | 3.180 | 3.045 | 3.110 | 3.062 | 3.104 | 2.985 | 2.939 | 2.771 | 2.689 | 2.745 |
| 2014 | 2.731 | 2.845 | 3.031 | 3.191 | 3.108 | 3.160 | 3.011 | 2.873 | 2.780 | 2.446 | 2.218 | 1.763 |
| 2015 | 1.515 | 1.857 | 2.040 | 2.101 | 2.396 | 2.346 | 2.418 | 2.106 | 1.847 | 1.786 | 1.663 | 1.652 |
| 2016 | 1.468 | 1.260 | 1.615 | 1.719 | 1.799 | 1.848 | 1.678 | 1.641 | 1.687 | 1.754 | 1.606 | 1.737 |
| 2017 | 1.807 | 1.861 | 1.873 | 1.952 | 1.914 | 1.793 | 1.825 | 1.905 | 2.021 | 1.907 | 1.980 | 1.879 |
| 2018 | 2.049 | 2.053 | 2.160 | 2.313 | 2.447 | 2.354 | 2.355 | 2.301 | 2.360 | 2.361 | 1.997 | 1.825 |
| 2019 | 1.807 | 1.956 | 2.173 | 2.547 | 2.462 | 2.219 | 2.249 | 2.096 | 2.223 | 2.344 | 2.214 | 2.067 |
| 2020 | 2.108 | 2.053 | 1.494 | 1.005 | 1.358 | 1.560 | 1.617 | 1.662 | 1.604 | 1.584 | 1.579 | 1.672 |
| 2021 | 1.882 | 2.095 | 2.329 | 2.380 | 2.492 | 2.562 | 2.600 | 2.576 | 2.589 | 2.824 | 2.900 | 2.721 |
| 2022 | 2.831 | 3.047 | 3.729 | |||||||||
| - = No Data Reported; -- = Not Applicable; NA = Not Available; W = Withheld to avoid disclosure of individual company data. |
| Release Date: 6/1/2022 |
| Next Release Date: TBD |