|
Download Data (XLS File) |
|
||||||||
|
||||||||
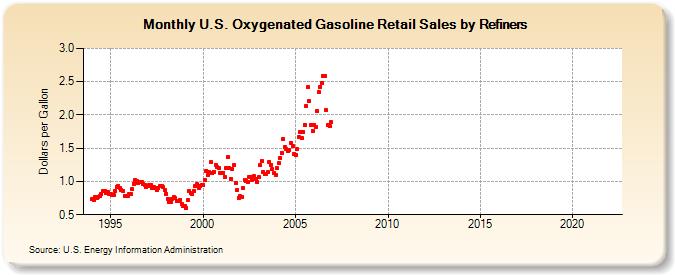
| U.S. Oxygenated Gasoline Retail Sales by Refiners (Dollars per Gallon) | ||||||||
| Year | Jan | Feb | Mar | Apr | May | Jun | Jul | Aug | Sep | Oct | Nov | Dec |
|---|---|---|---|---|---|---|---|---|---|---|---|---|
| 1994 | 0.733 | 0.727 | 0.761 | 0.744 | 0.769 | 0.788 | 0.814 | 0.863 | 0.860 | 0.832 | 0.841 | 0.812 |
| 1995 | 0.804 | 0.800 | 0.803 | 0.862 | 0.914 | 0.932 | 0.907 | 0.875 | 0.860 | 0.787 | 0.788 | 0.786 |
| 1996 | 0.804 | 0.818 | 0.879 | 0.966 | 1.015 | 1.000 | 0.979 | 0.992 | 0.998 | 0.965 | 0.952 | 0.918 |
| 1997 | 0.926 | 0.947 | 0.952 | 0.909 | 0.916 | 0.903 | 0.875 | 0.901 | 0.937 | 0.926 | 0.911 | 0.873 |
| 1998 | 0.817 | 0.741 | 0.685 | 0.692 | 0.741 | 0.760 | 0.746 | 0.707 | 0.701 | 0.726 | 0.667 | 0.636 |
| 1999 | 0.630 | 0.606 | 0.716 | 0.854 | 0.830 | 0.814 | 0.860 | 0.928 | 0.956 | 0.908 | 0.933 | 0.947 |
| 2000 | 0.954 | 1.024 | 1.161 | 1.099 | 1.145 | 1.286 | 1.120 | 1.149 | 1.251 | 1.223 | 1.206 | 1.131 |
| 2001 | 1.132 | 1.132 | 1.067 | 1.208 | 1.365 | 1.203 | 1.042 | 1.185 | 1.240 | 0.978 | 0.869 | 0.754 |
| 2002 | 0.775 | 0.768 | 0.900 | 1.026 | 1.005 | 0.997 | 1.068 | 1.062 | 1.027 | 1.076 | 1.030 | 0.989 |
| 2003 | 1.064 | 1.242 | 1.307 | 1.148 | 1.105 | 1.118 | 1.141 | 1.291 | 1.254 | 1.187 | 1.130 | 1.092 |
| 2004 | 1.195 | 1.270 | 1.355 | 1.429 | 1.640 | 1.512 | 1.490 | 1.462 | 1.474 | 1.575 | 1.540 | 1.412 |
| 2005 | 1.401 | 1.487 | 1.669 | 1.750 | 1.649 | 1.743 | 1.854 | 2.136 | 2.413 | 2.209 | 1.854 | 1.764 |
| 2006 | 1.850 | 1.815 | 2.056 | 2.347 | 2.424 | 2.484 | 2.589 | 2.581 | 2.067 | 1.843 | 1.837 | 1.888 |
| 2007 | - | - | - | - | - | - | - | - | - | - | - | - |
| 2008 | - | - | - | - | - | - | - | - | - | - | - | - |
| 2009 | - | - | - | - | - | - | - | - | - | - | - | - |
| 2010 | - | - | - | - | - | - | - | - | - | - | - | - |
| 2011 | - | - | - | - | - | - | - | - | - | - | - | - |
| 2012 | - | - | - | - | - | - | - | - | - | - | - | - |
| 2013 | - | - | - | - | - | - | - | - | - | - | - | - |
| 2014 | - | - | - | - | - | - | - | - | - | - | - | - |
| 2015 | - | - | - | - | - | - | - | - | - | - | - | - |
| 2016 | - | - | - | - | - | - | - | - | - | - | - | - |
| 2017 | - | - | - | - | - | - | - | - | - | - | - | - |
| 2018 | - | - | - | - | - | - | - | - | - | - | - | - |
| 2019 | - | - | - | - | - | - | - | - | - | - | - | - |
| 2020 | - | - | - | - | - | - | - | - | - | - | - | - |
| 2021 | - | - | - | - | - | - | - | - | - | - | - | - |
| 2022 | - | - | - | |||||||||
| - = No Data Reported; -- = Not Applicable; NA = Not Available; W = Withheld to avoid disclosure of individual company data. |
| Release Date: 6/1/2022 |
| Next Release Date: TBD |