|
Download Data (XLS File) |
|
||||||||
|
||||||||
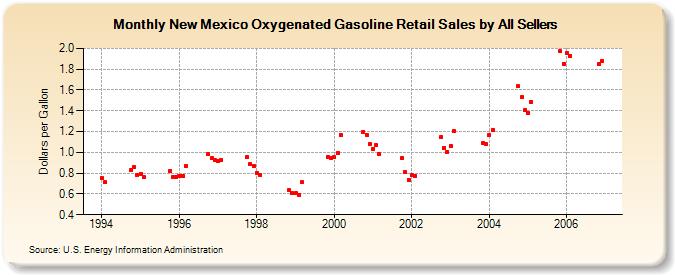
| New Mexico Oxygenated Gasoline Retail Sales by All Sellers (Dollars per Gallon) | ||||||||
| Year | Jan | Feb | Mar | Apr | May | Jun | Jul | Aug | Sep | Oct | Nov | Dec |
|---|---|---|---|---|---|---|---|---|---|---|---|---|
| 1994 | 0.752 | 0.712 | W | W | W | W | W | W | W | 0.830 | 0.857 | 0.781 |
| 1995 | 0.793 | 0.759 | W | W | W | W | W | W | W | 0.819 | 0.763 | 0.767 |
| 1996 | 0.775 | 0.777 | 0.870 | W | W | W | W | W | W | 0.983 | 0.945 | 0.926 |
| 1997 | 0.919 | 0.926 | W | W | W | W | W | W | W | 0.953 | 0.888 | 0.869 |
| 1998 | 0.800 | 0.782 | W | W | W | W | W | - | - | W | 0.634 | 0.608 |
| 1999 | 0.608 | 0.587 | 0.710 | W | W | W | NA | NA | W | W | 0.957 | 0.947 |
| 2000 | 0.951 | 0.994 | 1.166 | W | W | W | W | W | W | 1.198 | 1.167 | 1.082 |
| 2001 | 1.035 | 1.067 | 0.985 | W | W | W | W | W | W | 0.945 | 0.808 | 0.737 |
| 2002 | 0.778 | 0.777 | W | W | W | W | W | W | W | 1.143 | 1.044 | 1.005 |
| 2003 | 1.062 | 1.204 | W | W | W | W | W | W | W | W | 1.091 | 1.078 |
| 2004 | 1.163 | 1.215 | W | W | W | W | W | W | W | 1.634 | 1.528 | 1.404 |
| 2005 | 1.379 | 1.483 | W | W | W | W | W | W | W | W | 1.973 | 1.853 |
| 2006 | 1.954 | 1.931 | W | W | W | W | W | W | W | W | 1.851 | 1.881 |
| - = No Data Reported; -- = Not Applicable; NA = Not Available; W = Withheld to avoid disclosure of individual company data. |
| Release Date: 6/1/2022 |
| Next Release Date: TBD |