|
Download Data (XLS File) |
|
||||||||
|
||||||||
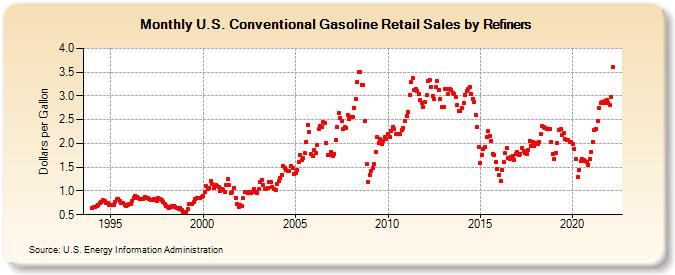
| U.S. Conventional Gasoline Retail Sales by Refiners (Dollars per Gallon) | ||||||||
| Year | Jan | Feb | Mar | Apr | May | Jun | Jul | Aug | Sep | Oct | Nov | Dec |
|---|---|---|---|---|---|---|---|---|---|---|---|---|
| 1994 | 0.643 | 0.662 | 0.665 | 0.693 | 0.711 | 0.740 | 0.769 | 0.814 | 0.794 | 0.754 | 0.748 | 0.707 |
| 1995 | 0.699 | 0.697 | 0.707 | 0.760 | 0.825 | 0.827 | 0.784 | 0.755 | 0.748 | 0.711 | 0.685 | 0.704 |
| 1996 | 0.722 | 0.724 | 0.783 | 0.860 | 0.893 | 0.866 | 0.844 | 0.825 | 0.831 | 0.831 | 0.866 | 0.857 |
| 1997 | 0.854 | 0.838 | 0.818 | 0.818 | 0.828 | 0.817 | 0.799 | 0.851 | 0.837 | 0.802 | 0.772 | 0.729 |
| 1998 | 0.690 | 0.665 | 0.642 | 0.660 | 0.689 | 0.683 | 0.671 | 0.639 | 0.626 | 0.641 | 0.606 | 0.555 |
| 1999 | 0.554 | 0.534 | 0.610 | 0.726 | 0.733 | 0.721 | 0.771 | 0.823 | 0.862 | 0.848 | 0.859 | 0.881 |
| 2000 | 0.900 | 0.977 | 1.097 | 1.036 | 1.071 | 1.204 | 1.139 | 1.055 | 1.129 | 1.108 | 1.086 | 1.008 |
| 2001 | 1.034 | 1.028 | 0.987 | 1.134 | 1.245 | 1.126 | 0.951 | 0.988 | 1.070 | 0.851 | 0.730 | 0.672 |
| 2002 | 0.694 | 0.691 | 0.844 | 0.974 | 0.968 | 0.956 | 0.974 | 0.967 | 0.972 | 1.032 | 0.981 | 0.954 |
| 2003 | 1.034 | 1.196 | 1.238 | 1.126 | 1.035 | 1.047 | 1.069 | 1.187 | 1.192 | 1.088 | 1.041 | 1.020 |
| 2004 | 1.147 | 1.203 | 1.275 | 1.343 | 1.522 | 1.482 | 1.434 | 1.414 | 1.412 | 1.531 | 1.488 | 1.360 |
| 2005 | 1.373 | 1.435 | 1.609 | 1.760 | 1.657 | 1.683 | 1.797 | 2.038 | 2.385 | 2.238 | 1.779 | 1.728 |
| 2006 | 1.854 | 1.793 | 1.962 | 2.300 | 2.363 | 2.347 | 2.455 | 2.433 | 2.014 | 1.755 | 1.759 | 1.824 |
| 2007 | 1.735 | 1.788 | 2.064 | 2.342 | 2.633 | 2.533 | 2.463 | 2.303 | 2.338 | 2.331 | 2.595 | 2.517 |
| 2008 | 2.549 | 2.556 | 2.756 | 2.944 | 3.291 | 3.508 | 3.513 | 3.239 | 3.225 | 2.473 | 1.559 | 1.196 |
| 2009 | 1.336 | 1.429 | 1.476 | 1.559 | 1.826 | 2.142 | 2.006 | 2.091 | 1.991 | 2.043 | 2.125 | 2.101 |
| 2010 | 2.196 | 2.131 | 2.268 | 2.340 | 2.308 | 2.198 | 2.192 | 2.197 | 2.189 | 2.283 | 2.335 | 2.474 |
| 2011 | 2.579 | 2.669 | 3.023 | 3.293 | 3.370 | 3.133 | 3.140 | 3.104 | 3.037 | 2.915 | 2.854 | 2.763 |
| 2012 | 2.863 | 3.011 | 3.310 | 3.343 | 3.197 | 2.993 | 2.927 | 3.197 | 3.304 | 3.121 | 2.925 | 2.761 |
| 2013 | 2.775 | 3.142 | 3.155 | 3.030 | 3.137 | 3.122 | 3.063 | 3.042 | 2.973 | 2.814 | 2.693 | 2.687 |
| 2014 | 2.747 | 2.847 | 3.023 | 3.103 | 3.154 | 3.194 | 3.030 | 2.942 | 2.865 | 2.603 | 2.354 | 1.929 |
| 2015 | 1.586 | 1.763 | 1.884 | 1.917 | 2.131 | 2.253 | 2.161 | 2.057 | 1.785 | 1.759 | 1.601 | 1.472 |
| 2016 | 1.346 | 1.209 | 1.450 | 1.617 | 1.790 | 1.894 | 1.697 | 1.682 | 1.708 | 1.738 | 1.660 | 1.781 |
| 2017 | 1.812 | 1.748 | 1.787 | 1.904 | 1.851 | 1.795 | 1.769 | 1.854 | 2.059 | 1.951 | 2.029 | 1.946 |
| 2018 | 2.009 | 1.996 | 2.021 | 2.196 | 2.377 | 2.345 | 2.333 | 2.314 | 2.313 | 2.297 | 2.035 | 1.782 |
| 2019 | 1.672 | 1.798 | 1.999 | 2.292 | 2.311 | 2.170 | 2.222 | 2.086 | 2.080 | 2.071 | 2.022 | 2.030 |
| 2020 | 1.995 | 1.886 | 1.663 | 1.286 | 1.443 | 1.626 | 1.664 | 1.653 | 1.637 | 1.602 | 1.555 | 1.667 |
| 2021 | 1.828 | 2.039 | 2.274 | 2.311 | 2.462 | 2.745 | 2.859 | 2.878 | 2.859 | 2.887 | 2.918 | 2.855 |
| 2022 | 2.803 | 2.979 | 3.604 | |||||||||
| - = No Data Reported; -- = Not Applicable; NA = Not Available; W = Withheld to avoid disclosure of individual company data. |
| Release Date: 6/1/2022 |
| Next Release Date: TBD |