|
Download Data (XLS File) |
|
||||||||
|
||||||||
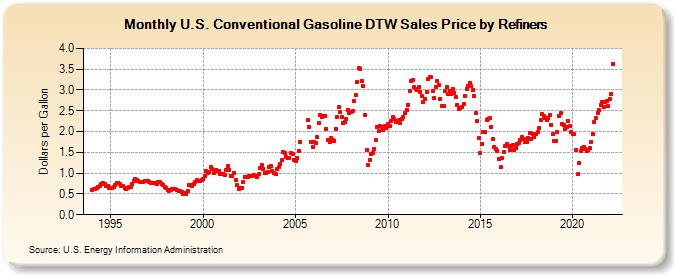
| U.S. Conventional Gasoline DTW Sales Price by Refiners (Dollars per Gallon) | ||||||||
| Year | Jan | Feb | Mar | Apr | May | Jun | Jul | Aug | Sep | Oct | Nov | Dec |
|---|---|---|---|---|---|---|---|---|---|---|---|---|
| 1994 | 0.593 | 0.617 | 0.619 | 0.646 | 0.666 | 0.700 | 0.727 | 0.757 | 0.733 | 0.692 | 0.690 | 0.636 |
| 1995 | 0.645 | 0.654 | 0.655 | 0.707 | 0.768 | 0.769 | 0.727 | 0.696 | 0.691 | 0.650 | 0.626 | 0.647 |
| 1996 | 0.662 | 0.678 | 0.732 | 0.810 | 0.854 | 0.824 | 0.799 | 0.779 | 0.784 | 0.794 | 0.818 | 0.802 |
| 1997 | 0.806 | 0.787 | 0.761 | 0.766 | 0.769 | 0.758 | 0.735 | 0.793 | 0.781 | 0.739 | 0.708 | 0.663 |
| 1998 | 0.637 | 0.604 | 0.577 | 0.593 | 0.626 | 0.621 | 0.611 | 0.584 | 0.571 | 0.581 | 0.555 | 0.507 |
| 1999 | 0.512 | 0.492 | 0.565 | 0.710 | 0.708 | 0.692 | 0.744 | 0.797 | 0.828 | 0.806 | 0.820 | 0.837 |
| 2000 | 0.852 | 0.926 | 1.048 | 0.997 | 1.024 | 1.143 | 1.090 | 1.006 | 1.074 | 1.056 | 1.043 | 0.976 |
| 2001 | 0.982 | 0.976 | 0.944 | 1.068 | 1.178 | 1.086 | 0.924 | 0.926 | 1.005 | 0.829 | 0.704 | 0.621 |
| 2002 | 0.638 | 0.637 | 0.784 | 0.919 | 0.917 | 0.917 | 0.933 | 0.925 | 0.926 | 0.967 | 0.933 | 0.902 |
| 2003 | 0.973 | 1.135 | 1.188 | 1.107 | 1.007 | 1.013 | 1.024 | 1.150 | 1.174 | 1.054 | 1.002 | 0.970 |
| 2004 | 1.088 | 1.148 | 1.226 | 1.318 | 1.507 | 1.475 | 1.393 | 1.369 | 1.375 | 1.485 | 1.449 | 1.317 |
| 2005 | 1.300 | 1.374 | 1.542 | 1.743 | W | W | W | W | 2.275 | 2.121 | 1.755 | 1.639 |
| 2006 | 1.752 | 1.721 | 1.859 | 2.205 | 2.410 | 2.355 | 2.377 | 2.371 | 2.072 | 1.785 | 1.756 | 1.842 |
| 2007 | 1.786 | 1.775 | 2.073 | 2.347 | 2.589 | 2.464 | 2.356 | 2.197 | 2.237 | 2.300 | 2.526 | 2.458 |
| 2008 | 2.459 | 2.492 | 2.726 | 2.891 | 3.200 | 3.533 | 3.501 | 3.227 | 3.085 | 2.406 | 1.559 | 1.196 |
| 2009 | 1.316 | 1.461 | 1.478 | 1.570 | 1.794 | 2.112 | 2.002 | 2.128 | 2.116 | 2.033 | 2.128 | 2.088 |
| 2010 | 2.176 | 2.127 | 2.262 | 2.346 | 2.290 | 2.231 | 2.258 | 2.276 | 2.200 | 2.291 | 2.339 | 2.435 |
| 2011 | 2.516 | 2.636 | 2.983 | 3.206 | 3.230 | 3.068 | 3.027 | 3.001 | 3.066 | 2.963 | 2.858 | 2.714 |
| 2012 | 2.780 | 2.959 | 3.256 | 3.308 | 3.300 | 2.982 | 2.802 | 3.071 | 3.219 | 3.123 | 2.786 | 2.625 |
| 2013 | 2.622 | 2.964 | 3.070 | 2.904 | 2.973 | 2.908 | 3.012 | 2.934 | 2.827 | 2.645 | 2.533 | 2.566 |
| 2014 | 2.594 | 2.661 | 2.862 | 3.032 | 3.090 | 3.163 | 3.092 | 3.001 | 2.854 | 2.456 | 2.253 | 1.835 |
| 2015 | 1.475 | 1.709 | 1.984 | 1.979 | 2.285 | 2.311 | 2.319 | 2.109 | 1.812 | 1.637 | 1.591 | 1.532 |
| 2016 | 1.337 | 1.143 | 1.369 | 1.498 | 1.641 | 1.696 | 1.643 | 1.566 | 1.658 | 1.685 | 1.557 | 1.599 |
| 2017 | 1.700 | 1.721 | 1.808 | 1.872 | 1.823 | 1.745 | 1.751 | 1.845 | 1.960 | 1.832 | 1.939 | 1.857 |
| 2018 | 1.931 | 1.980 | 2.097 | 2.278 | 2.431 | 2.383 | 2.332 | 2.280 | 2.318 | 2.406 | 2.164 | 1.930 |
| 2019 | 1.772 | 1.781 | 2.001 | 2.366 | 2.438 | 2.187 | 2.168 | 2.057 | 2.098 | 2.259 | 2.132 | 1.978 |
| 2020 | 1.934 | 1.930 | 1.560 | 0.971 | 1.240 | 1.523 | 1.612 | 1.625 | 1.584 | 1.524 | 1.554 | 1.605 |
| 2021 | 1.758 | 1.946 | 2.228 | 2.320 | 2.445 | 2.508 | 2.634 | 2.713 | 2.602 | 2.710 | 2.746 | 2.613 |
| 2022 | 2.785 | 2.908 | 3.618 | |||||||||
| - = No Data Reported; -- = Not Applicable; NA = Not Available; W = Withheld to avoid disclosure of individual company data. |
| Release Date: 6/1/2022 |
| Next Release Date: TBD |