|
Download Data (XLS File) |
|
||||||||
|
||||||||
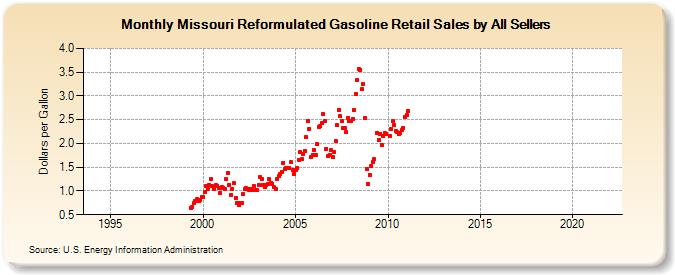
| Missouri Reformulated Gasoline Retail Sales by All Sellers (Dollars per Gallon) | ||||||||
| Year | Jan | Feb | Mar | Apr | May | Jun | Jul | Aug | Sep | Oct | Nov | Dec |
|---|---|---|---|---|---|---|---|---|---|---|---|---|
| 1994 | - | - | - | - | - | - | - | - | - | - | - | - |
| 1995 | - | - | - | - | - | - | - | - | - | - | - | - |
| 1996 | - | - | - | - | - | - | - | - | - | - | - | - |
| 1997 | - | - | - | - | - | - | - | - | - | - | - | - |
| 1998 | - | - | - | - | - | - | - | - | - | - | - | - |
| 1999 | W | W | W | W | 0.646 | 0.666 | 0.739 | 0.782 | 0.823 | 0.793 | 0.810 | 0.877 |
| 2000 | 0.874 | 0.973 | 1.097 | 1.031 | 1.126 | 1.247 | 1.104 | 1.041 | 1.123 | 1.102 | 1.070 | 0.965 |
| 2001 | 1.074 | 1.061 | 1.032 | 1.242 | 1.387 | 1.132 | 0.911 | 1.047 | 1.160 | 0.862 | 0.738 | 0.709 |
| 2002 | 0.756 | 0.744 | 0.927 | 1.035 | 1.059 | 1.038 | 1.029 | 1.042 | 1.025 | 1.109 | 1.012 | 1.020 |
| 2003 | 1.124 | 1.296 | 1.254 | 1.119 | 1.077 | 1.127 | 1.152 | 1.244 | 1.167 | 1.144 | 1.075 | 1.042 |
| 2004 | 1.255 | 1.314 | 1.360 | 1.405 | 1.597 | 1.455 | 1.485 | 1.474 | 1.493 | 1.607 | 1.431 | 1.357 |
| 2005 | 1.436 | 1.483 | 1.654 | 1.820 | 1.665 | 1.778 | 1.850 | 2.127 | 2.481 | 2.305 | 1.718 | 1.767 |
| 2006 | 1.861 | 1.763 | 1.985 | 2.343 | 2.366 | 2.424 | 2.619 | 2.476 | 1.892 | 1.726 | 1.759 | 1.855 |
| 2007 | 1.704 | 1.811 | 2.060 | 2.380 | 2.705 | 2.571 | 2.469 | 2.317 | 2.321 | 2.236 | 2.545 | 2.475 |
| 2008 | 2.477 | 2.511 | 2.704 | 3.038 | 3.340 | 3.570 | 3.551 | 3.150 | 3.261 | 2.526 | 1.455 | 1.152 |
| 2009 | 1.336 | 1.521 | 1.619 | 1.663 | NA | 2.224 | 2.080 | 2.204 | 1.964 | 2.146 | 2.218 | 2.204 |
| 2010 | NA | 2.164 | 2.313 | 2.463 | 2.396 | 2.271 | 2.234 | 2.194 | 2.219 | 2.286 | 2.321 | 2.564 |
| 2011 | 2.595 | 2.684 | - | - | - | - | - | - | - | - | - | - |
| 2012 | - | - | - | - | - | - | - | - | - | - | - | - |
| 2013 | - | - | - | - | - | - | - | - | - | - | - | - |
| 2014 | - | - | - | - | - | - | - | - | - | - | - | - |
| 2015 | - | - | - | - | - | - | - | - | - | - | - | - |
| 2016 | - | - | - | - | - | - | - | - | - | - | - | - |
| 2017 | - | - | - | - | - | - | - | - | - | - | - | - |
| 2018 | - | - | - | - | - | - | - | - | - | - | - | - |
| 2019 | - | - | - | - | - | - | - | - | - | - | - | - |
| 2020 | - | - | - | - | - | - | - | - | - | - | - | - |
| 2021 | - | - | - | - | - | - | - | - | - | - | - | - |
| 2022 | - | - | - | |||||||||
| - = No Data Reported; -- = Not Applicable; NA = Not Available; W = Withheld to avoid disclosure of individual company data. |
| Release Date: 6/1/2022 |
| Next Release Date: TBD |