|
Download Data (XLS File) |
|
||||||||
|
||||||||
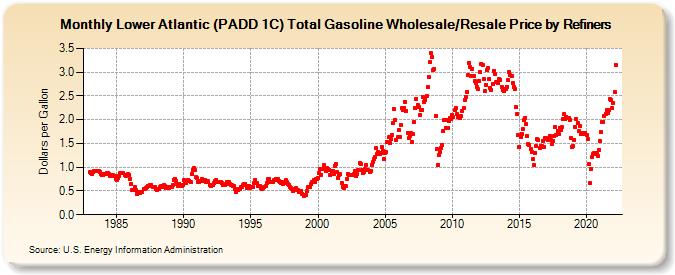
| Lower Atlantic (PADD 1C) Total Gasoline Wholesale/Resale Price by Refiners (Dollars per Gallon) | ||||||||
| Year | Jan | Feb | Mar | Apr | May | Jun | Jul | Aug | Sep | Oct | Nov | Dec |
|---|---|---|---|---|---|---|---|---|---|---|---|---|
| 1983 | 0.889 | 0.871 | 0.856 | 0.892 | 0.922 | 0.923 | 0.926 | 0.920 | 0.911 | 0.890 | 0.866 | 0.831 |
| 1984 | 0.828 | 0.856 | 0.861 | 0.875 | 0.869 | 0.849 | 0.822 | 0.816 | 0.835 | 0.835 | 0.807 | 0.762 |
| 1985 | 0.740 | 0.770 | 0.820 | 0.871 | 0.880 | 0.875 | 0.870 | 0.846 | 0.824 | 0.835 | 0.862 | 0.836 |
| 1986 | 0.757 | 0.642 | 0.512 | 0.511 | 0.574 | 0.524 | 0.438 | 0.475 | 0.476 | 0.460 | 0.476 | 0.484 |
| 1987 | 0.548 | 0.551 | 0.565 | 0.580 | 0.599 | 0.609 | 0.628 | 0.630 | 0.591 | 0.592 | 0.587 | 0.540 |
| 1988 | 0.525 | 0.537 | 0.540 | 0.588 | 0.598 | 0.588 | 0.629 | 0.601 | 0.563 | 0.576 | 0.592 | 0.556 |
| 1989 | 0.583 | 0.584 | 0.615 | 0.739 | 0.757 | 0.719 | 0.654 | 0.606 | 0.651 | 0.630 | 0.606 | 0.617 |
| 1990 | 0.724 | 0.685 | 0.668 | 0.703 | 0.734 | 0.716 | 0.696 | 0.856 | 0.942 | 0.981 | 0.945 | 0.784 |
| 1991 | 0.764 | 0.684 | 0.693 | 0.715 | 0.750 | 0.705 | 0.699 | 0.736 | 0.691 | 0.690 | 0.701 | 0.623 |
| 1992 | 0.602 | 0.622 | 0.626 | 0.667 | 0.711 | 0.732 | 0.688 | 0.686 | 0.691 | 0.681 | 0.661 | 0.620 |
| 1993 | 0.623 | 0.619 | 0.647 | 0.681 | 0.694 | 0.656 | 0.619 | 0.623 | 0.596 | 0.595 | 0.551 | 0.488 |
| 1994 | 0.516 | 0.545 | 0.549 | 0.583 | 0.586 | 0.617 | 0.636 | 0.654 | 0.570 | 0.595 | 0.609 | 0.552 |
| 1995 | 0.582 | 0.590 | 0.585 | 0.669 | 0.729 | 0.675 | 0.604 | 0.603 | 0.599 | 0.554 | 0.548 | 0.568 |
| 1996 | 0.586 | 0.597 | 0.661 | 0.746 | 0.743 | 0.681 | 0.689 | 0.680 | 0.692 | 0.724 | 0.748 | 0.736 |
| 1997 | 0.753 | 0.719 | 0.697 | 0.674 | 0.683 | 0.651 | 0.660 | 0.726 | 0.679 | 0.644 | 0.621 | 0.586 |
| 1998 | 0.554 | 0.531 | 0.507 | 0.535 | 0.553 | 0.529 | 0.514 | 0.472 | 0.480 | 0.508 | 0.446 | 0.395 |
| 1999 | 0.422 | 0.405 | 0.491 | 0.584 | 0.581 | 0.578 | 0.649 | 0.694 | 0.734 | 0.698 | 0.746 | 0.751 |
| 2000 | 0.777 | 0.881 | 0.964 | 0.845 | 0.959 | 1.040 | 0.953 | 0.921 | 0.981 | 0.956 | 0.951 | 0.826 |
| 2001 | 0.926 | 0.921 | 0.867 | 1.027 | 1.059 | 0.893 | 0.773 | 0.836 | 0.850 | 0.668 | 0.585 | 0.565 |
| 2002 | 0.594 | 0.596 | 0.760 | 0.863 | 0.842 | 0.826 | 0.843 | 0.843 | 0.863 | 0.918 | 0.811 | 0.852 |
| 2003 | 0.948 | 1.083 | 1.070 | 0.933 | 0.873 | 0.904 | 0.956 | 1.051 | 0.935 | 0.931 | 0.908 | 0.924 |
| 2004 | 1.052 | 1.104 | 1.174 | 1.218 | 1.402 | 1.276 | 1.314 | 1.279 | 1.302 | 1.435 | 1.348 | 1.165 |
| 2005 | 1.306 | 1.324 | 1.533 | 1.629 | 1.506 | 1.599 | 1.679 | 1.929 | 2.226 | 1.990 | 1.579 | 1.627 |
| 2006 | 1.779 | 1.636 | 1.887 | 2.240 | 2.199 | 2.247 | 2.379 | 2.181 | 1.719 | 1.608 | 1.647 | 1.713 |
| 2007 | 1.530 | 1.689 | 1.953 | 2.245 | 2.441 | 2.316 | 2.268 | 2.105 | 2.196 | 2.210 | 2.468 | 2.365 |
| 2008 | 2.418 | 2.488 | 2.678 | 2.895 | 3.204 | 3.398 | 3.309 | 3.044 | 3.066 | 2.078 | 1.381 | 1.055 |
| 2009 | 1.257 | 1.329 | 1.410 | 1.471 | 1.759 | 1.998 | 1.828 | 1.992 | 1.833 | 1.975 | 2.045 | 2.005 |
| 2010 | 2.105 | 2.047 | 2.199 | 2.251 | 2.110 | 2.061 | 2.051 | 2.040 | 2.069 | 2.192 | 2.238 | 2.410 |
| 2011 | 2.484 | 2.589 | 2.942 | 3.200 | 3.099 | 2.919 | 3.073 | 2.921 | 2.820 | 2.777 | 2.689 | 2.638 |
| 2012 | 2.815 | 2.994 | 3.182 | 3.158 | 2.860 | 2.606 | 2.738 | 3.038 | 3.082 | 2.847 | 2.675 | 2.629 |
| 2013 | 2.755 | 3.032 | 2.961 | 2.783 | 2.800 | 2.780 | 2.861 | 2.836 | 2.694 | 2.626 | 2.608 | 2.636 |
| 2014 | 2.635 | 2.693 | 2.825 | 3.006 | 2.931 | 2.918 | 2.772 | 2.694 | 2.649 | 2.275 | 2.120 | 1.681 |
| 2015 | 1.435 | 1.638 | 1.709 | 1.800 | 1.994 | 2.041 | 1.902 | 1.653 | 1.496 | 1.468 | 1.390 | 1.323 |
| 2016 | 1.169 | 1.047 | 1.302 | 1.444 | 1.586 | 1.562 | 1.398 | 1.446 | 1.444 | 1.553 | 1.415 | 1.612 |
| 2017 | 1.611 | 1.593 | 1.573 | 1.665 | 1.581 | 1.478 | 1.552 | 1.653 | 1.845 | 1.674 | 1.768 | 1.700 |
| 2018 | 1.835 | 1.787 | 1.840 | 2.006 | 2.124 | 2.020 | 2.060 | 2.028 | 2.041 | 1.989 | 1.621 | 1.431 |
| 2019 | 1.440 | 1.576 | 1.845 | 2.004 | 1.922 | 1.761 | 1.871 | 1.690 | 1.712 | 1.698 | 1.710 | 1.720 |
| 2020 | 1.684 | 1.587 | 1.063 | 0.660 | 0.969 | 1.213 | 1.272 | 1.294 | 1.294 | 1.269 | 1.241 | 1.372 |
| 2021 | 1.550 | 1.739 | 1.961 | 1.961 | 2.073 | 2.123 | 2.195 | 2.145 | 2.214 | 2.438 | 2.413 | 2.241 |
| 2022 | 2.361 | 2.588 | 3.160 | |||||||||
| - = No Data Reported; -- = Not Applicable; NA = Not Available; W = Withheld to avoid disclosure of individual company data. |
| Release Date: 6/1/2022 |
| Next Release Date: TBD |